Introduction
As organizations increasingly adopt cloud-native technologies like Kubernetes, managing costs becomes a growing concern. With multiple teams sharing the same cluster, it can be challenging to track and manage costs accurately and provide visibility into team-level expenses.
In this blog post, we'll explore how Kubecost - a widespread open-source cost monitoring and optimization tool, will help to show cost differences between two example teams, each owning and running their Airflow DAG with varying execution times, in a shared Kubernetes cluster. We'll dive into the details of Kubecost, its features, and how it can help you optimize costs, improve resource utilization, and make data-driven decisions.
Scenario
Our scenario involves two teams, Team_1 and Team_2, each with their own namespace in a shared Kubernetes cluster. Both teams use a shared Airflow instance, an open-source workflow management platform, to manage their workflows and trigger Airbyte sync jobs. Each team has its DAG (Directed Acyclic Graph) that runs for a different amount of time in their namespace. Team_1 DAG runs cumulatively for a little over 7 hours per day, while Team_2 DAG runs cumulatively for almost 2,5 hours daily.
Airflow DAGs
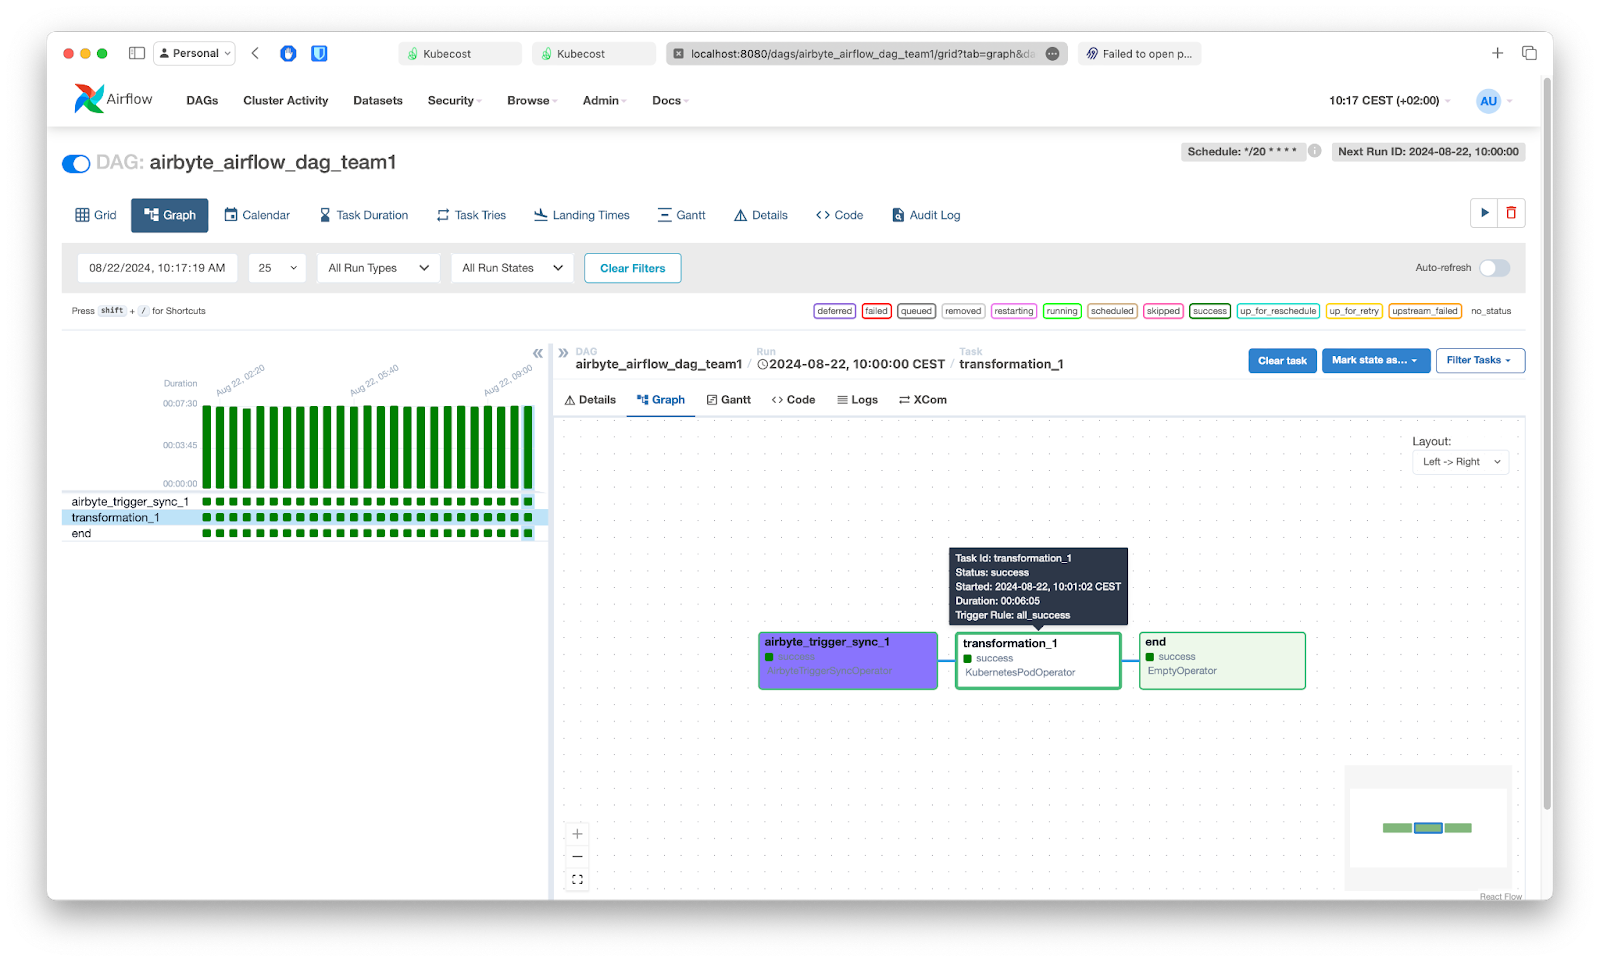
We will make shortcuts to mimic the Airbyte sync job in each team (which usually takes some time, depending on the amount of data). As you can see in the code block below, Kubernetes Airflow job pod is deployed into a namespace held by each team (team1 and team2 respectively). Pod itself does a chain job: trigger simple Airbyte job to sync data between Sample Data Faker and S3 bucket and then runs stress command with parameters as an Airflow transformation stage impostor. The job is then triggered based on cron every 20 minutes for Team_1 and 30 minutes for Team_2. We will be gathering data for three days.
from airflow import DAG
from airflow.providers.airbyte.operators.airbyte import AirbyteTriggerSyncOperator
from airflow.operators.empty import EmptyOperator
from airflow.providers.cncf.kubernetes.operators.kubernetes_pod import  KubernetesPodOperator
import pendulum
from kubernetes import client as k8s

executor_config_airbyte1= {
    "pod_override": k8s.V1Pod(
        metadata=k8s.V1ObjectMeta(
            namespace="team1"
        ),
    )
}

with DAG(dag_id="airbyte_airflow_dag_team1",
         default_args={"owner": "airflow"},
         schedule_interval='*/20 * * * *',
         catchup=False,
         start_date=pendulum.today("UTC").add(days=-1)
         ) as dag:

    trigger_airbyte_sync_1 = AirbyteTriggerSyncOperator(
        task_id="airbyte_trigger_sync_1",
        airbyte_conn_id="airbyte_1",
        connection_id="58410801-eee4-451e-8a8e-8a9af08f2e75",
        asynchronous=False,
        executor_config=executor_config_airbyte1,
    )

    transformation_1 = KubernetesPodOperator(
        namespace="team1",
        image="progrium/stress",
        name="airflow-airbyte-transformation-1",
        task_id="transformation_1",
        is_delete_operator_pod=True,
        cmds=["stress"],
        arguments=["--cpu", "3", "--io", "3", "--vm", "2", "--vm-bytes", "1024M", "--timeout", "360s"],
        get_logs=True,
        executor_config=executor_config_airbyte1,
    )

    end_task = EmptyOperator(task_id="end")

    trigger_airbyte_sync_1 >> transformation_1 >> end_task
Team_2 DAG is a copy of the one you see above with the difference of selected namespace and stress command arguments:
arguments=["--cpu", "1", "--io", "2", "--vm", "1", "--vm-bytes", "128M",
"--timeout", "160s"]
Both DAG files are committed to the Git repository, enabling Airflow to synchronize its contents and load the DAGs, thus making them accessible for users to view, manage, and trigger jobs within the Airflow interface. Of course, Helm was used to install Airflow:
helm repo add airflow https://airflow.apache.org
helm install airflow apache-airflow/airflow
--namespace airflow --values=airflow-values.yaml
--create-namespace=true
Value file is default with this minor change:
gitSync:
    enabled: true
    credentialsSecret: gitlab-credentials-secret
    # git repo clone url
    # ssh example: git@github.com:apache/airflow.git
    # https example: https://github.com/apache/airflow.git
    repo: https://gitlab.com/getindata/devops/dags.git
    branch: main
    rev: HEAD
Once done, set the port forward from airflow-webserver pod inside Kubernetes to reach Airflow UI and confirm that DAG sync is done and one can navigate inside DAG details.
Kubecost and Airbyte setup
To track costs and resource utilization, we've set up Kubecost, which provides detailed cost allocation and usage metrics, allowing us to drill down into costs by namespace, deployment, and even individual pods.
Deploy Kubecost to our Kubernetes cluster using Helm:
helm repo add kubecost https://kubecost.github.io/cost-analyzer/
helm install kubecost -n kubecost kubecost/cost-analyzer
--values=kubecost-values.yaml --create-namespace=true
In the values file there is nothing fancy: just a disabled grafana for it's not currently needed.
Airbyte is following a similar path: a clean install but in two different namespaces:
helm repo add airbyte https://airbytehq.github.io/helm-charts
helm install airbyte airbyte/airbyte --version 0.64.81 -n team1
helm install airbyte airbyte/airbyte --version 0.64.81 -n team2
Kubecost overview
Kubecost is a comprehensive cost monitoring and optimization platform explicitly designed for Kubernetes environments. It provides a wide range of features to help users break down costs by namespace, deployment, service, and more across any major cloud provider or on-prem Kubernetes environment. It can also help to optimize Kubernetes resource utilization, reduce costs, and improve overall efficiency.
Key Kubecost features:
- Real-time Cost Monitoring: Kubecost provides real-time cost monitoring of Kubernetes resources, including CPU, memory, storage, and network usage.
- Cost Allocation: Kubecost supports cost allocation, which enables users to assign costs to specific teams, departments, or projects. This feature helps track costs at a granular level and make informed decisions about resource allocation.
- Alerting and Notifications: Real-time notifications preserve engineering workflows by integrating with tools like Microsoft Teams and Slack. Email notifications are also available.
- Reporting and Dashboards: Customizable reporting and dashboards that provide a way to visualize their costs and resource utilization.
- Integration with Prometheus: The Kubecost Prometheus deployment is optimized to not interfere with other observability instrumentation and by default, only contains metrics useful to the Kubecost product. This results in 70-90% fewer metrics than a Prometheus deployment using default settings.
- Support for Multiple Cloud Providers: Support for multiple cloud providers, including AWS, GCP, and Azure.
On to cost comparison
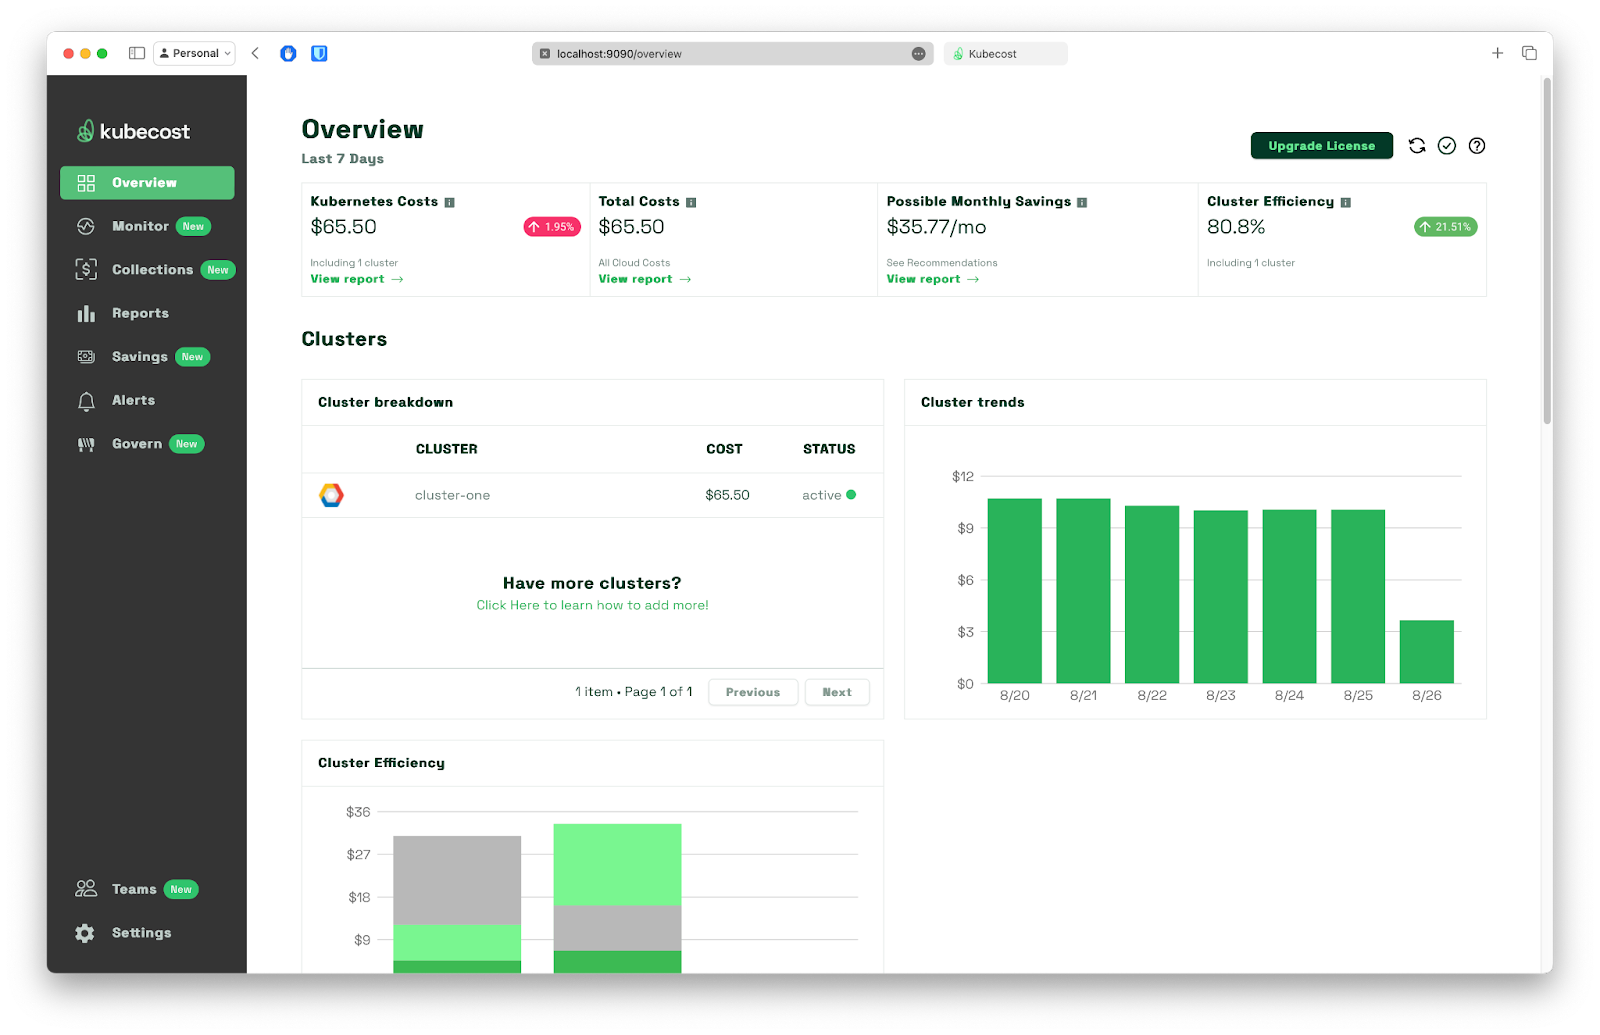
With Kubecost up and running, we can now see detailed cost information for each team. The overview dashboard provides a clear breakdown of costs by namespace, allowing us to identify which team is incurring the most expenses easily. We can also take a quick look at the Cluster Details page:
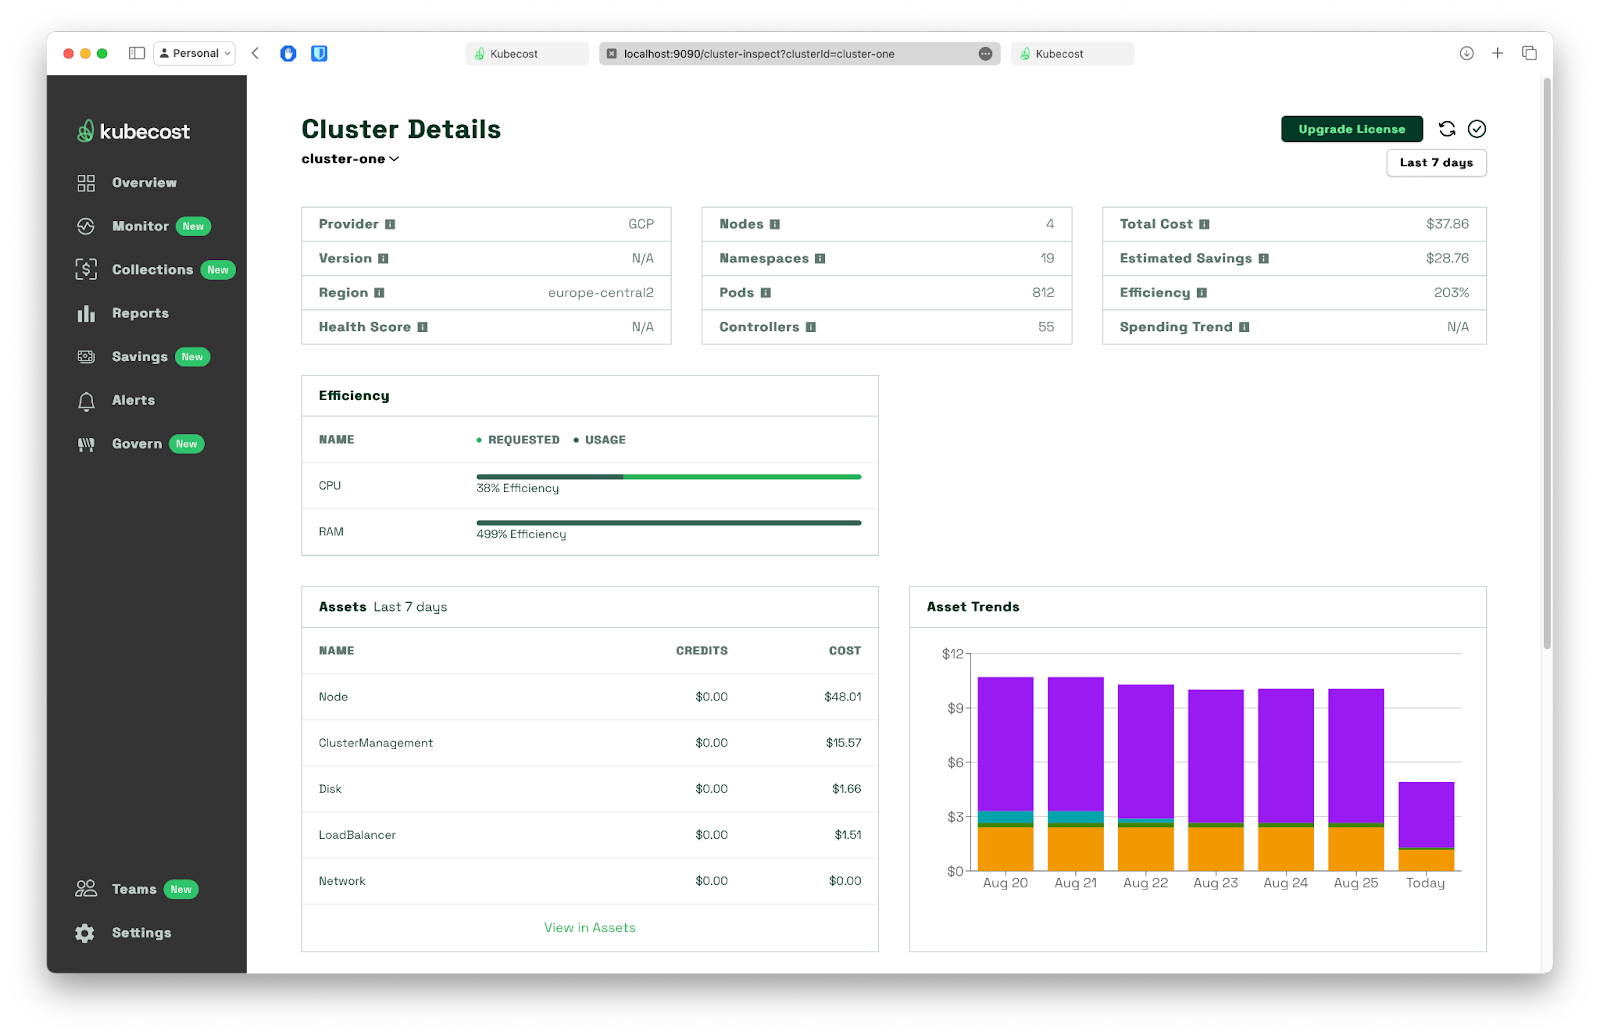
By navigating to Monitor > Allocations and filtering the data we are interested in based on the namespace and three-day period, we can quickly see Team_1 and Team_2total costs with a breakdown to each deployment:
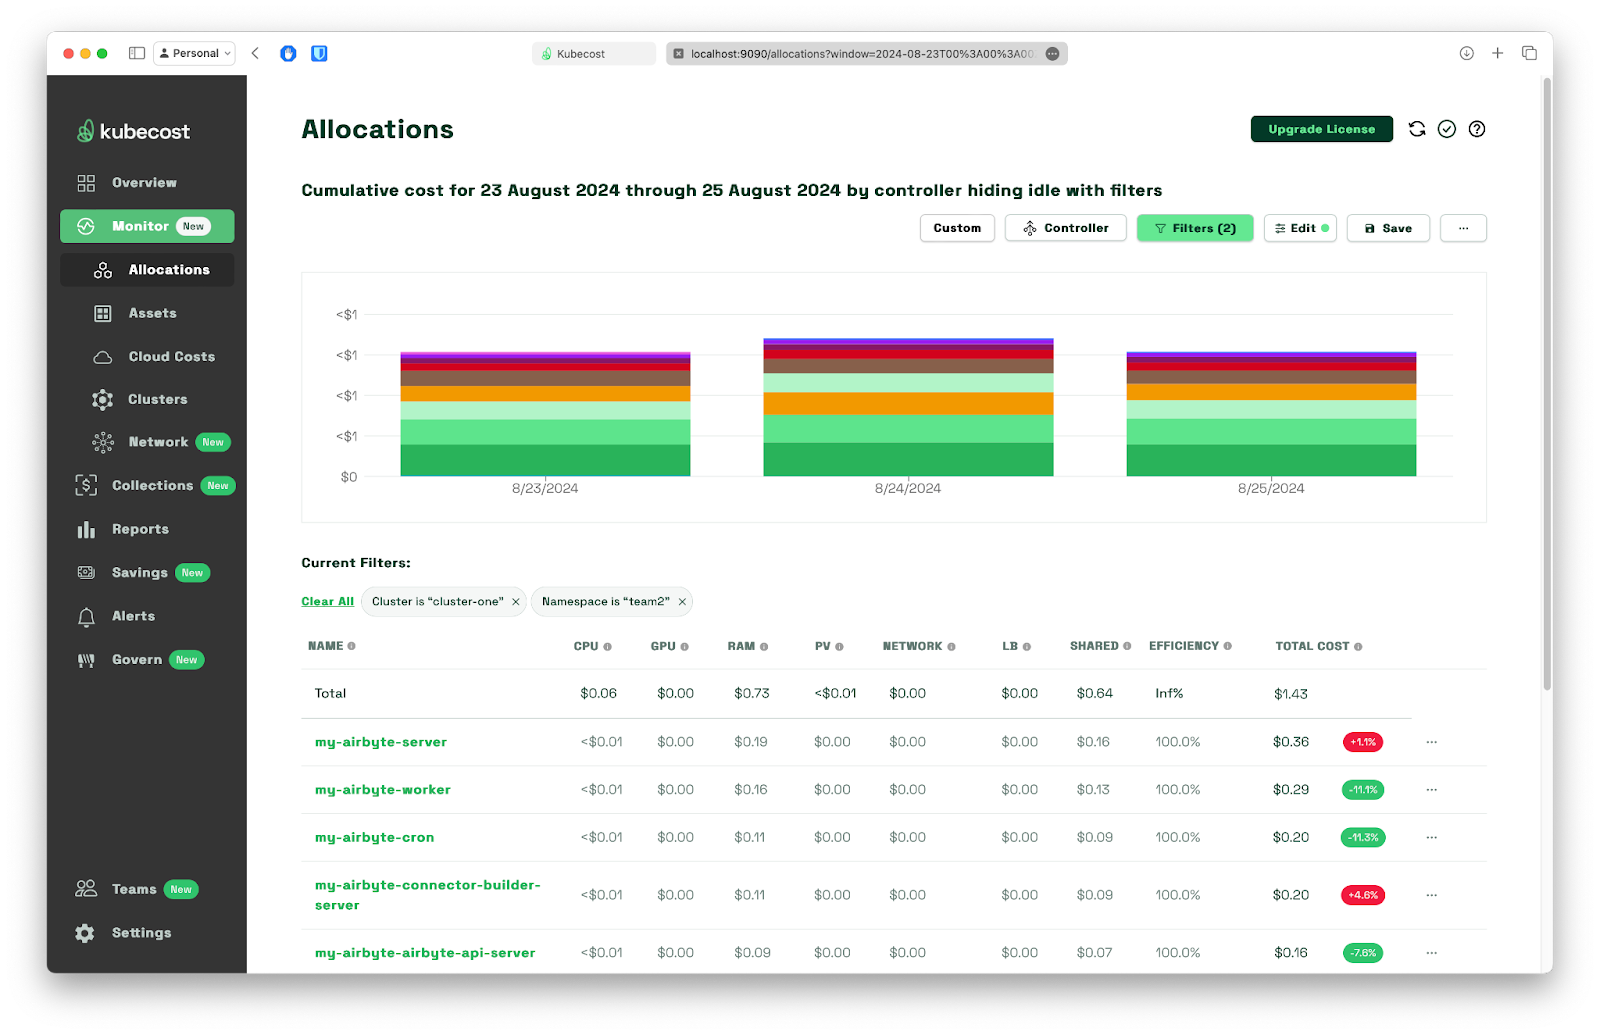
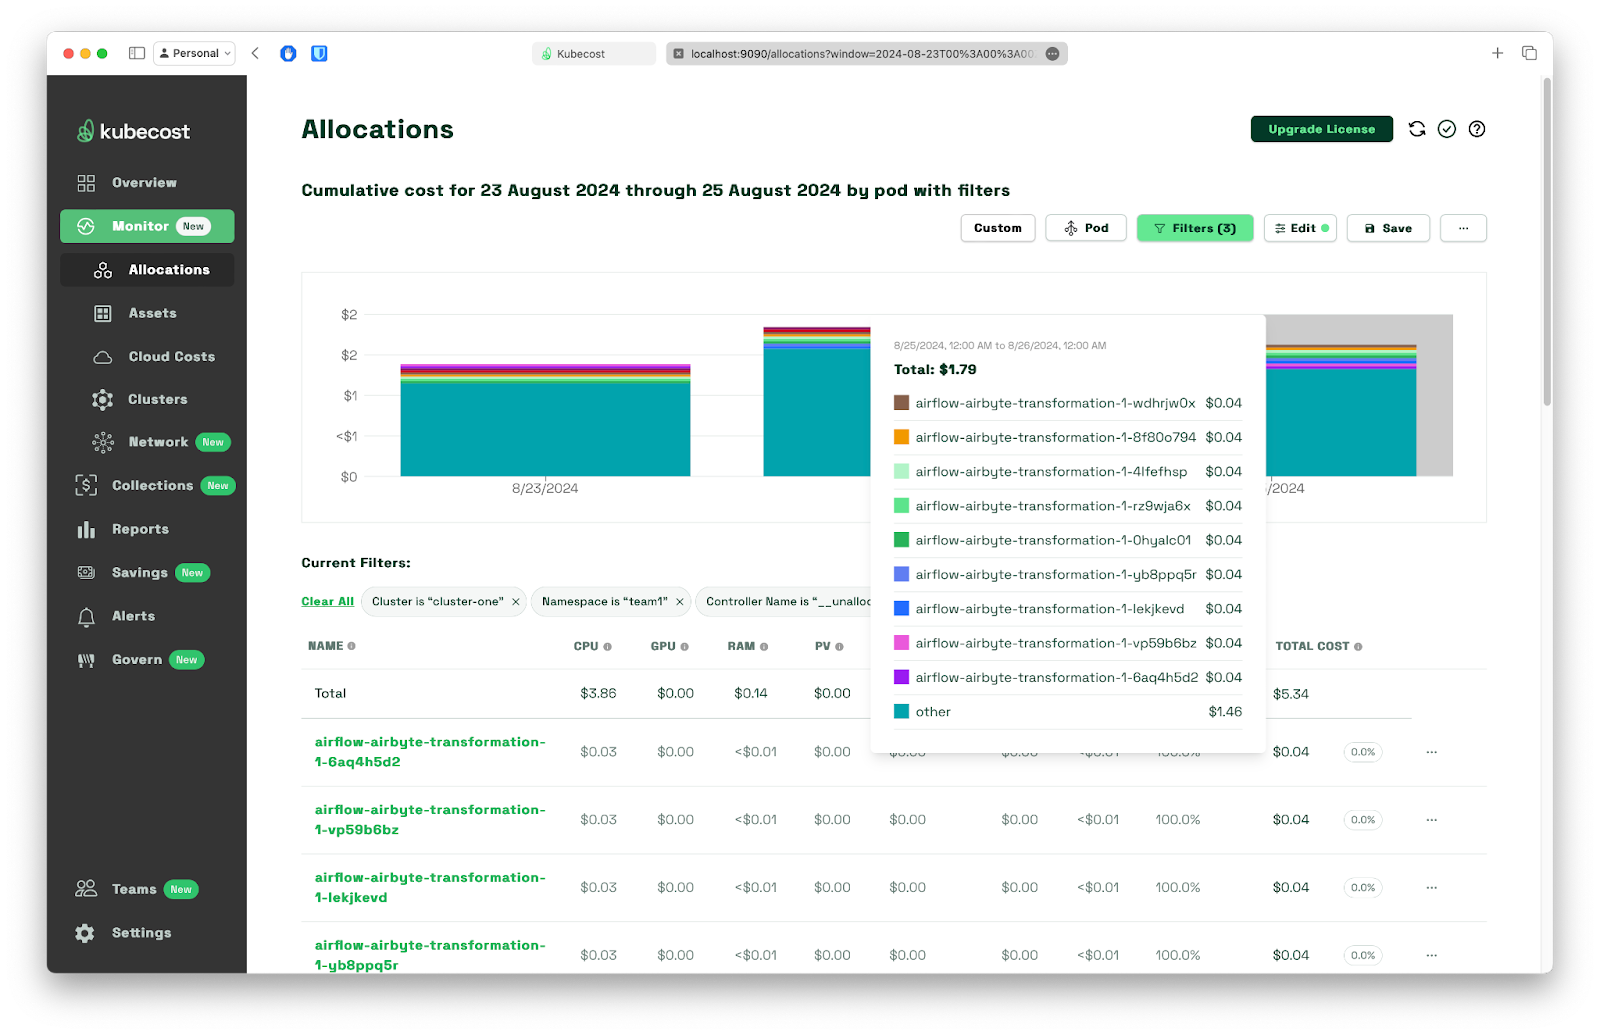
To drill down into - in this case - a group of resources under a quite suspicious name Uncontrolled workloads, we just need to click on its name to see that hiding behind that name are just airflow-transformations pods - this is the step where we run stress command. This type of pods are grouped under an uncontrolled name because kubescaller does not support them.
Now, back to analysis.
As expected, Team_1 longer and more frequently running DAG results in higher overall costs. Because for this exercise, the cluster was using single node configuration only, I’ve decided to skip shared and idle costs encapsulated and presented within the __idle__ section in the cost breakdown, to highlight the differences.
Now, we can get a precise cost difference between two teams when both namespaces are combined under a single filter and aggregated by namespace, as presented below.
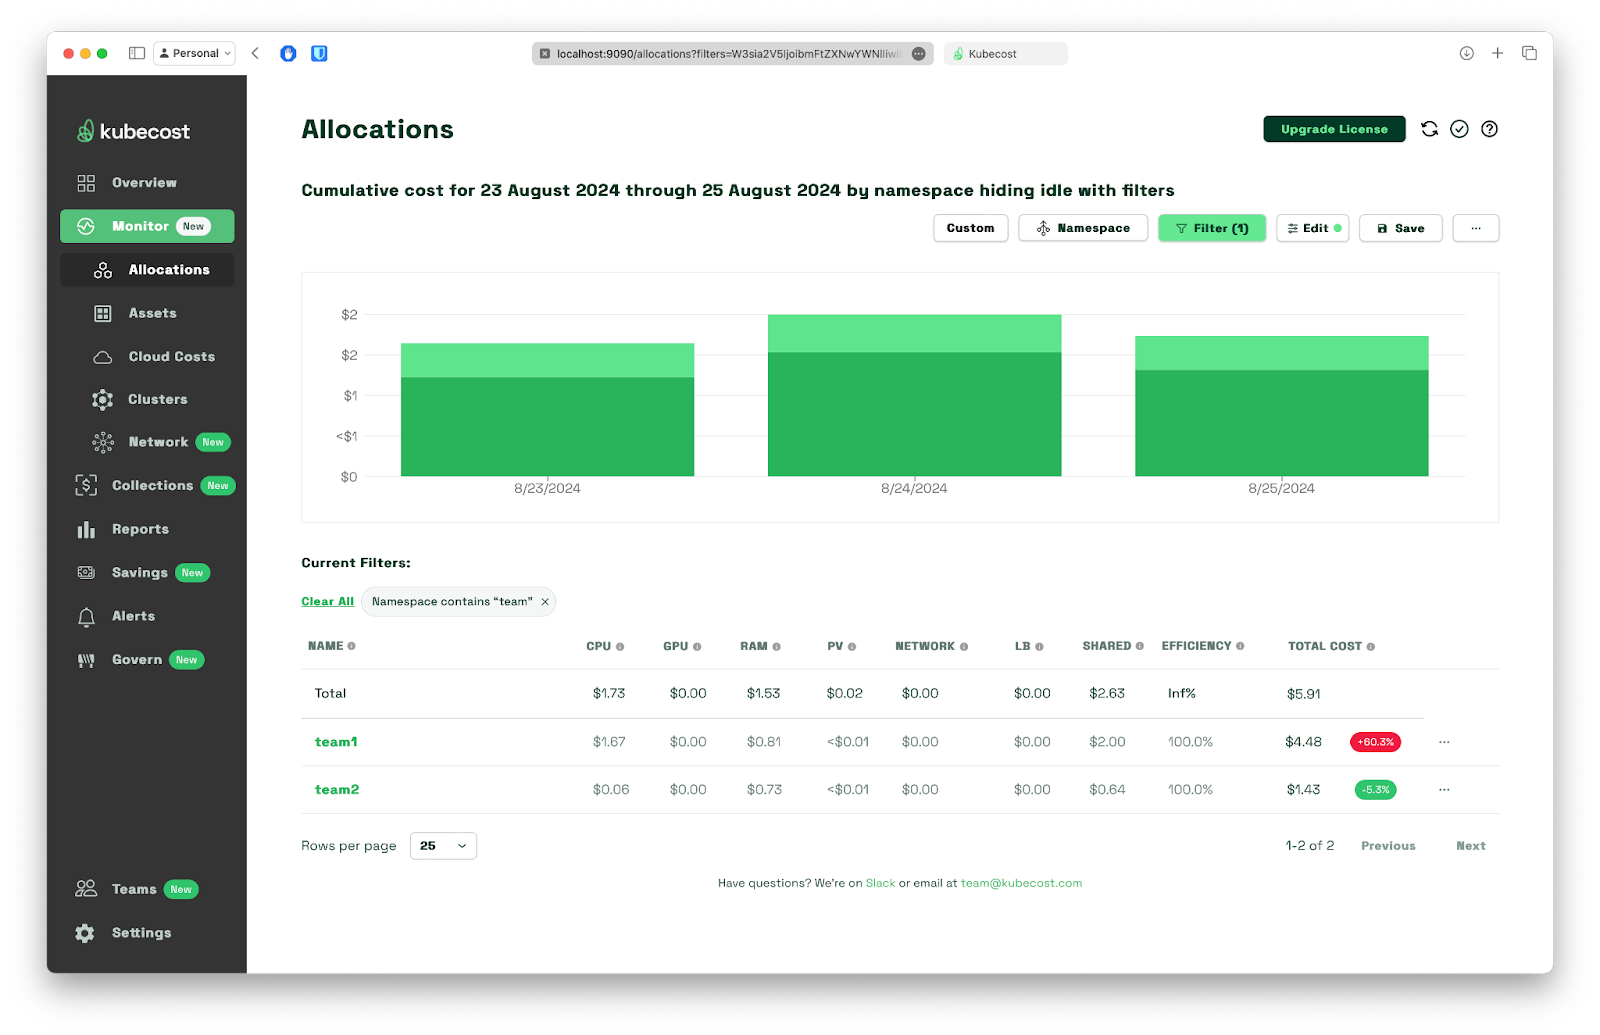
By analyzing the cost drivers, we can see that the Airflow transformation jobs are the primary contributors to Team_1 and Team_2 costs. This information can be used to optimize the workflows, reduce costs, and improve overall efficiency.
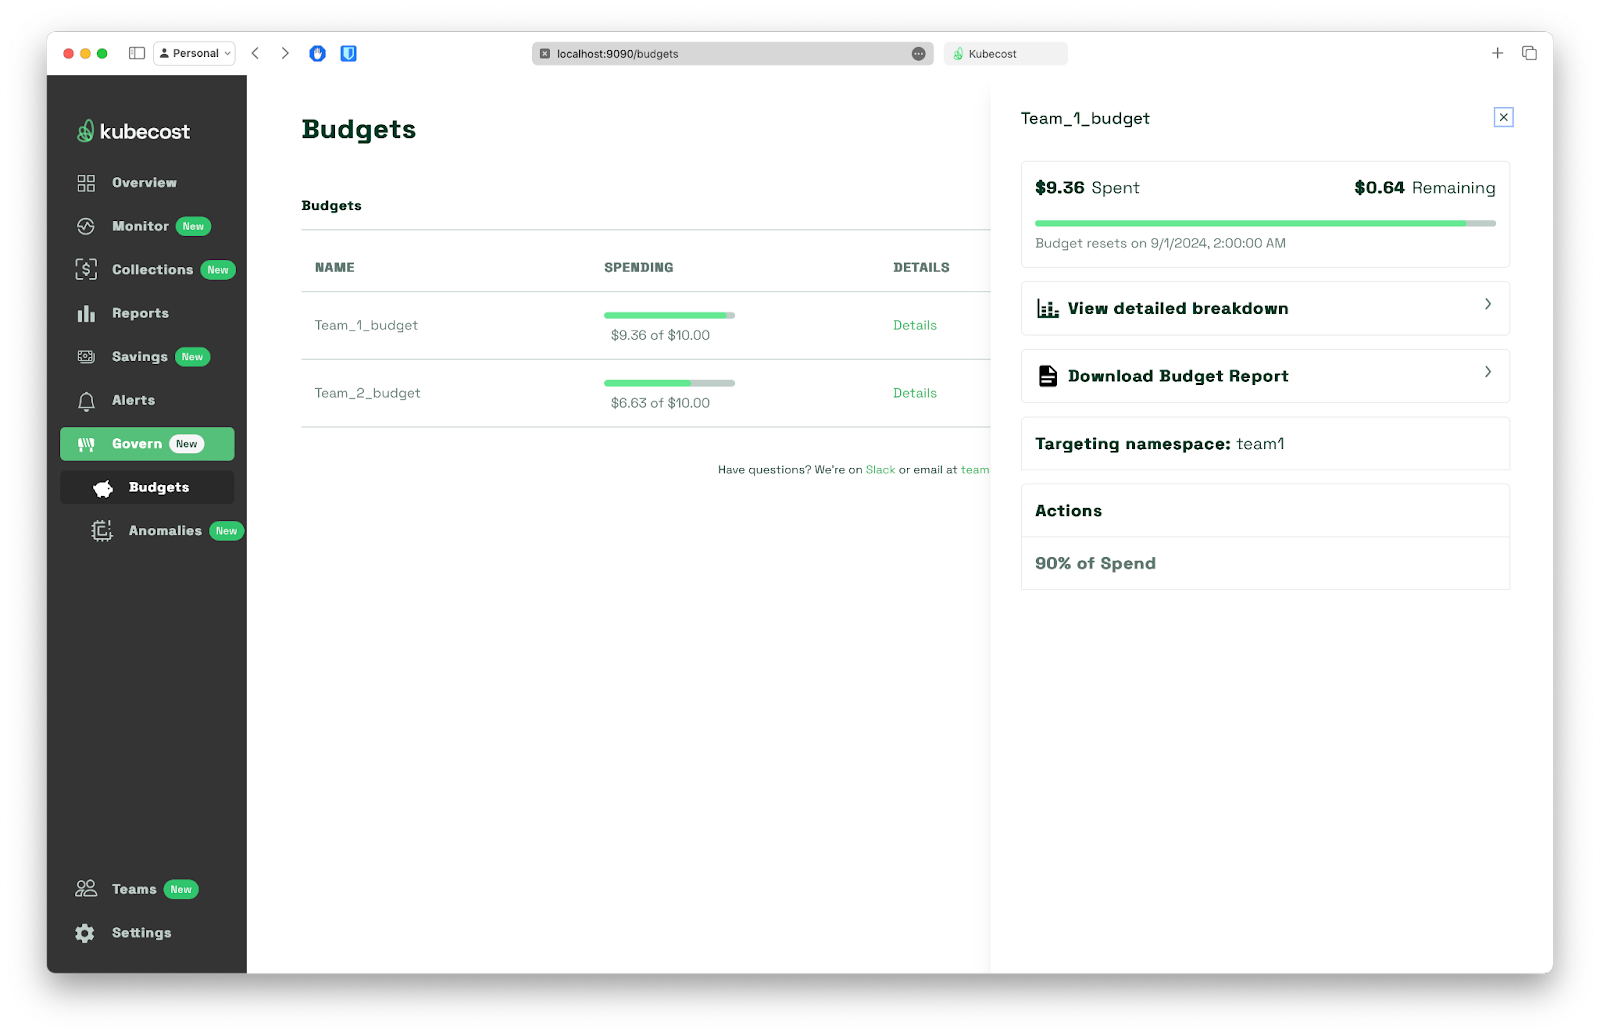
We can also set up a budget for each team / namespace by navigating to Govern > Budgets.
This will help keep track of current consumption versus the one we’ve agreed on. Notifications can also be configured to inform users about reaching a certain threshold and pop a message to email Slack or MS Teams.
Conclusion
Kubecost provides valuable insights into cost differences between teams in a shared Kubernetes cluster. By tracking costs and resource utilization, teams can identify areas for optimization and make data-driven decisions to reduce costs. In this scenario, we've seen how Kubecost helped us uncover cost differences between two teams running Airflow DAGs with varying execution times, setup budgets for each team namespace. Whether you're a developer, DevOps engineer, or financial analyst, Kubecost is an essential tool for anyone looking to manage costs in a Kubernetes environment.
By using Kubecost, teams can:
- Track costs by namespace, deployment, and go as low as pod level
- Identify areas for optimization and reduce costs
- Make data-driven decisions to improve resource utilization
- Improve collaboration and communication between teams
Do you want to stay updated with articles, tips, and tutorials full of practical content? Sign up for our newsletter, where we share only the best content once a quarter, like this article you just read.