Data-driven fast-track: 3 steps to make your company more data-driven
Hardly anyone needs convincing that the more a data-driven company you are, the better. We all have examples of great tech companies in mind. The…
Read moreAt GetInData, we understand the value of full observability across our application stacks.
For our Customers, we always recommend solutions able to provide such visibility.
Stay with me throughout this post; you will see why it is so popular, important, and desired.
Full observability brings many benefits to your application stacks:
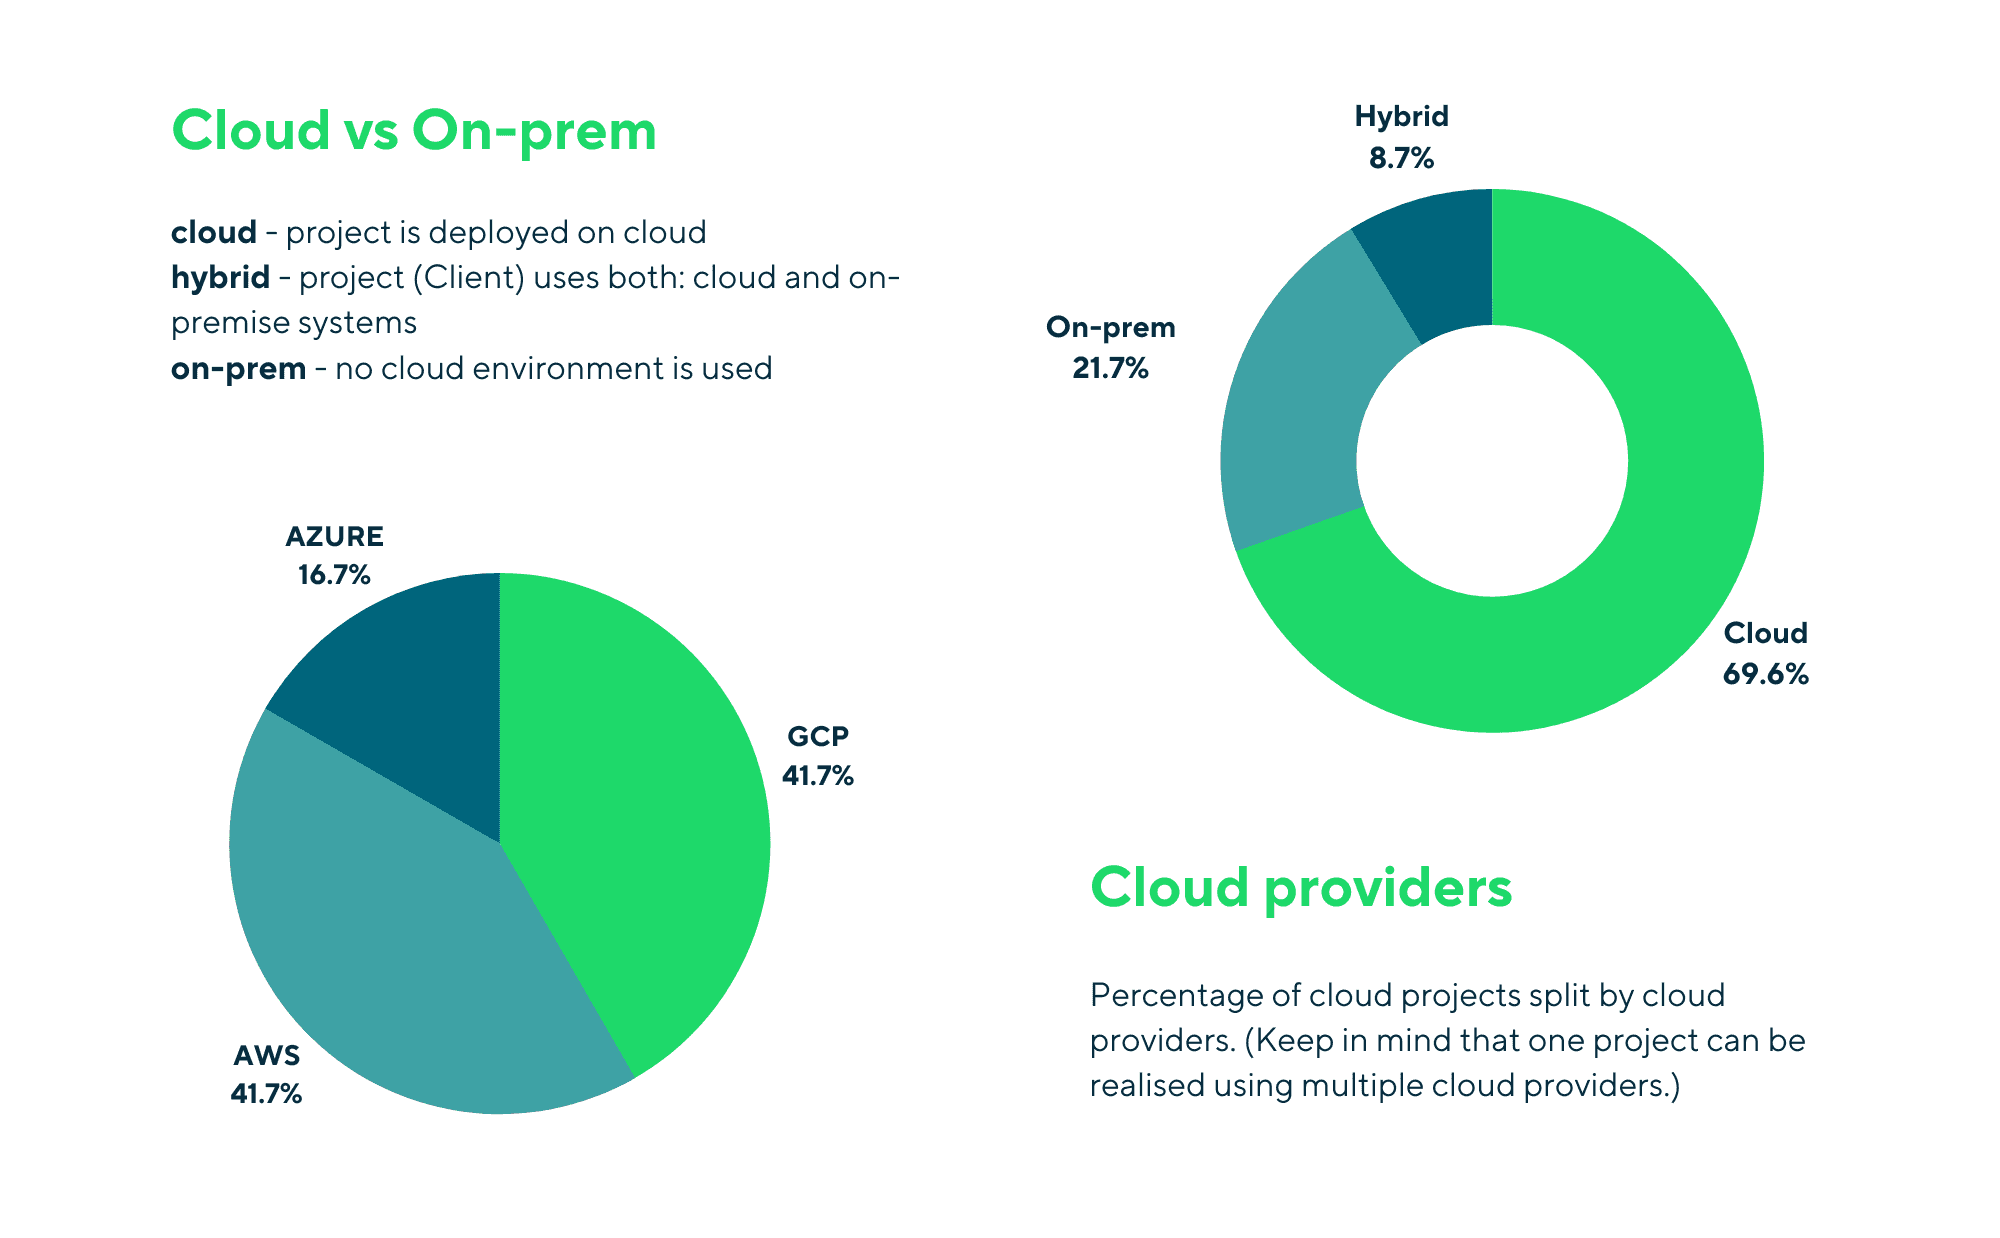
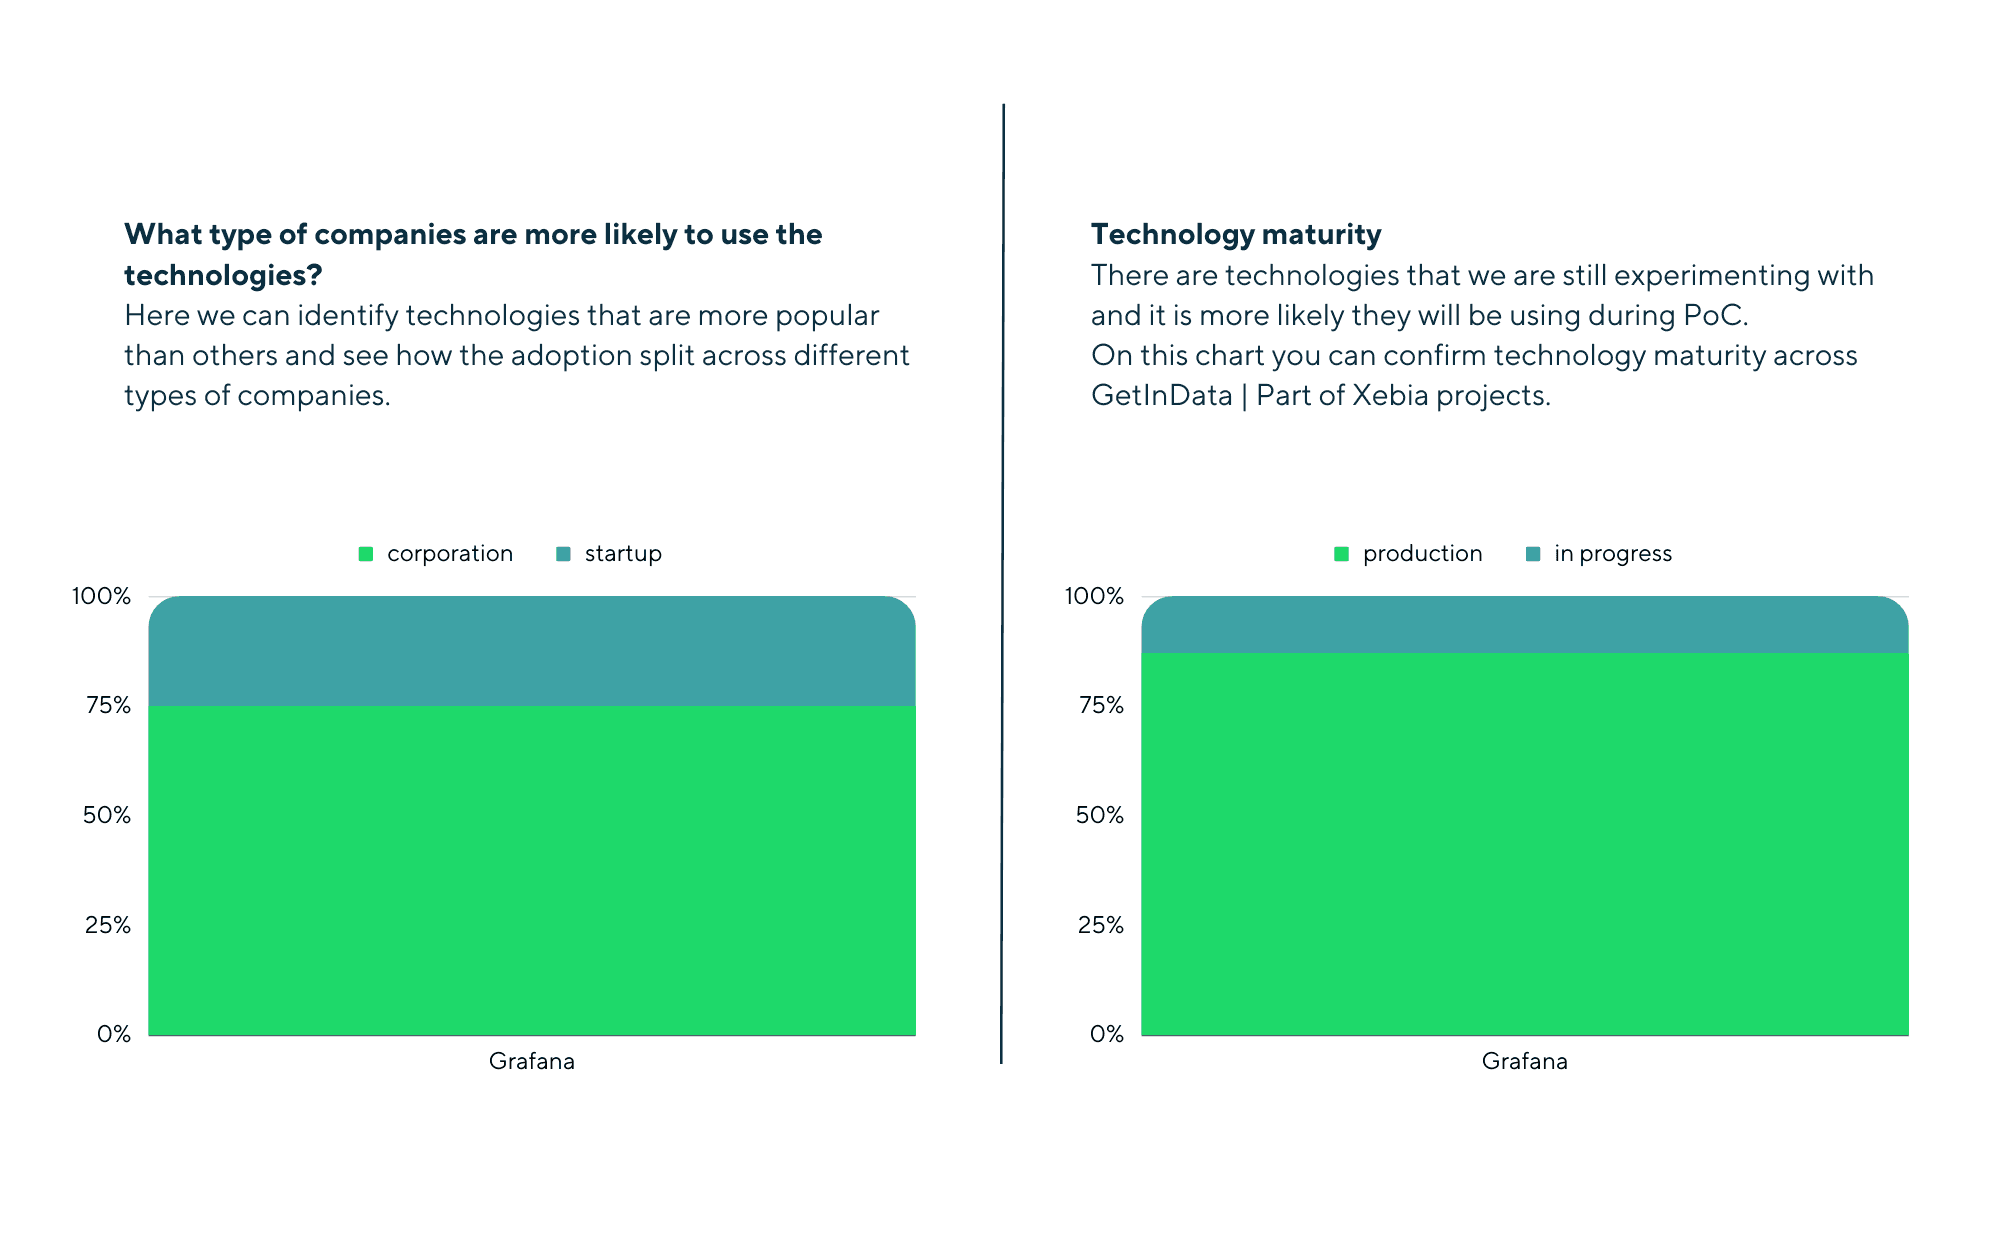
More than half of GetInData's currently active projects are those where we manage observability stacks completely, which means we design, implement and maintain monitoring, logging, and tracing of our application stacks:
To be able to reuse our stack in multiple project scenarios, it needs to be flexible.
Generally, our requirements for the stack are:
The ability to deploy our stack across multiple cloud providers comes with Kubernetes (K8s).
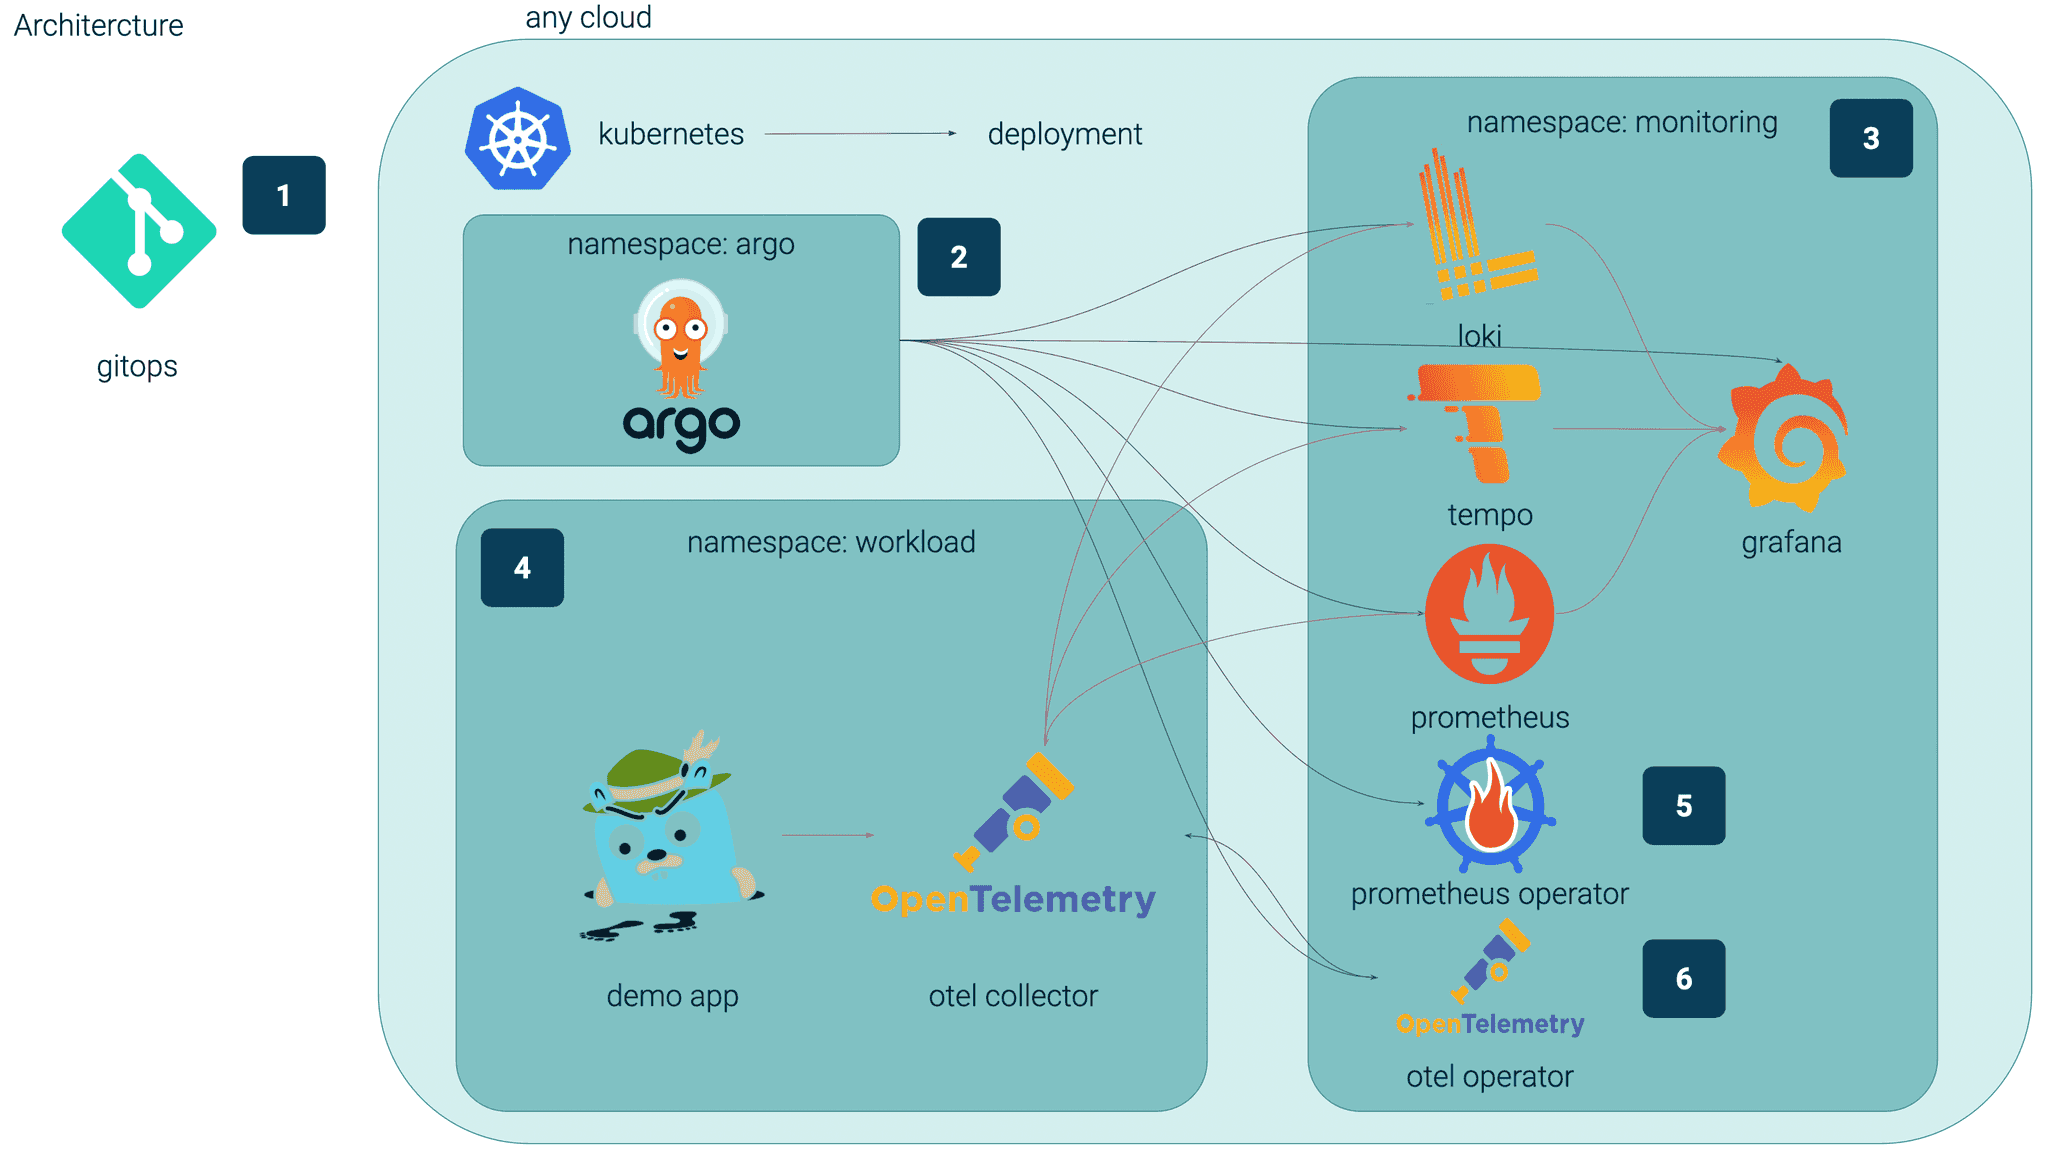
The idea is simple: deploy the stack on top of any cloud-based Kubernetes. That’s it!
Plenty of tools are out there, but as always, some are better than others.
Those that we use provide the best functionality currently available.
Having your results is one thing, but waiting for them can definitely ruin all the fun.
This is why we rely on modern tools that are able to provide the best performance.


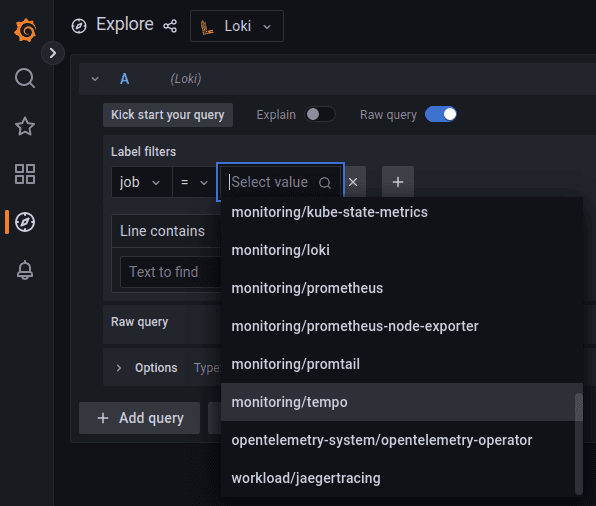
Loki provides centralized logging already integrated with Tempo, available via Grafana:
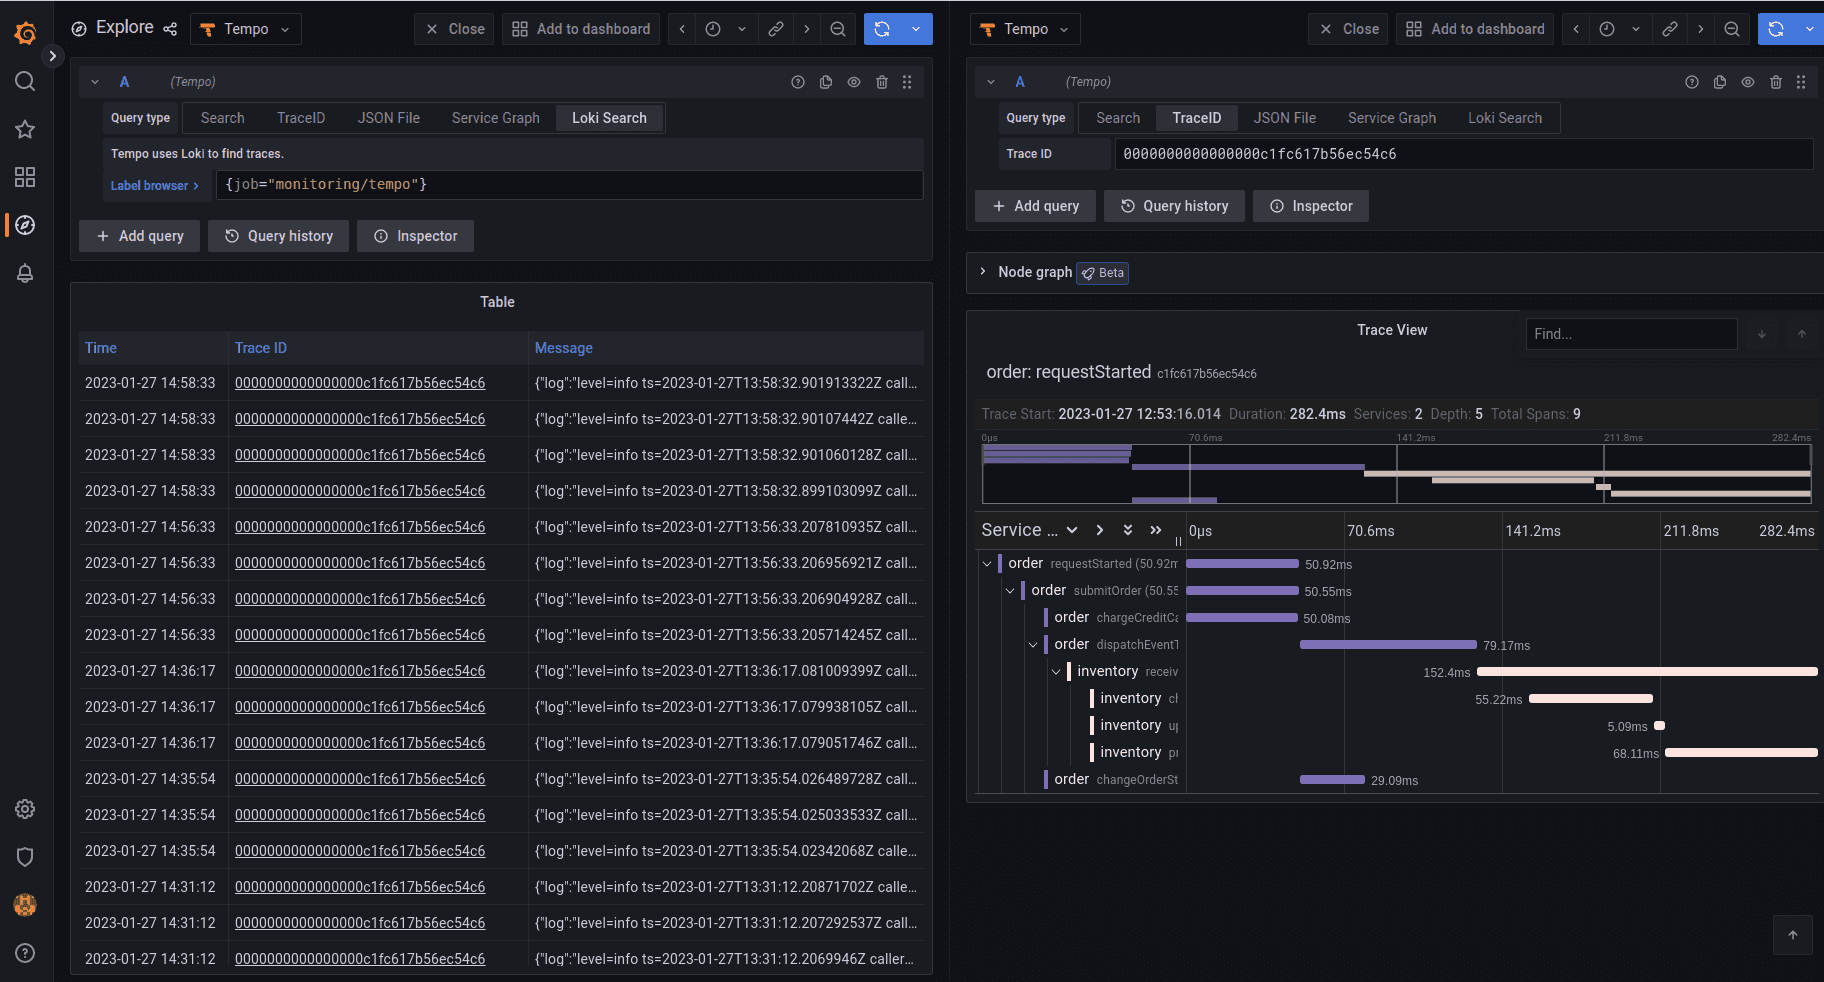
You can search traces in logs and view them in tempo at the same time:
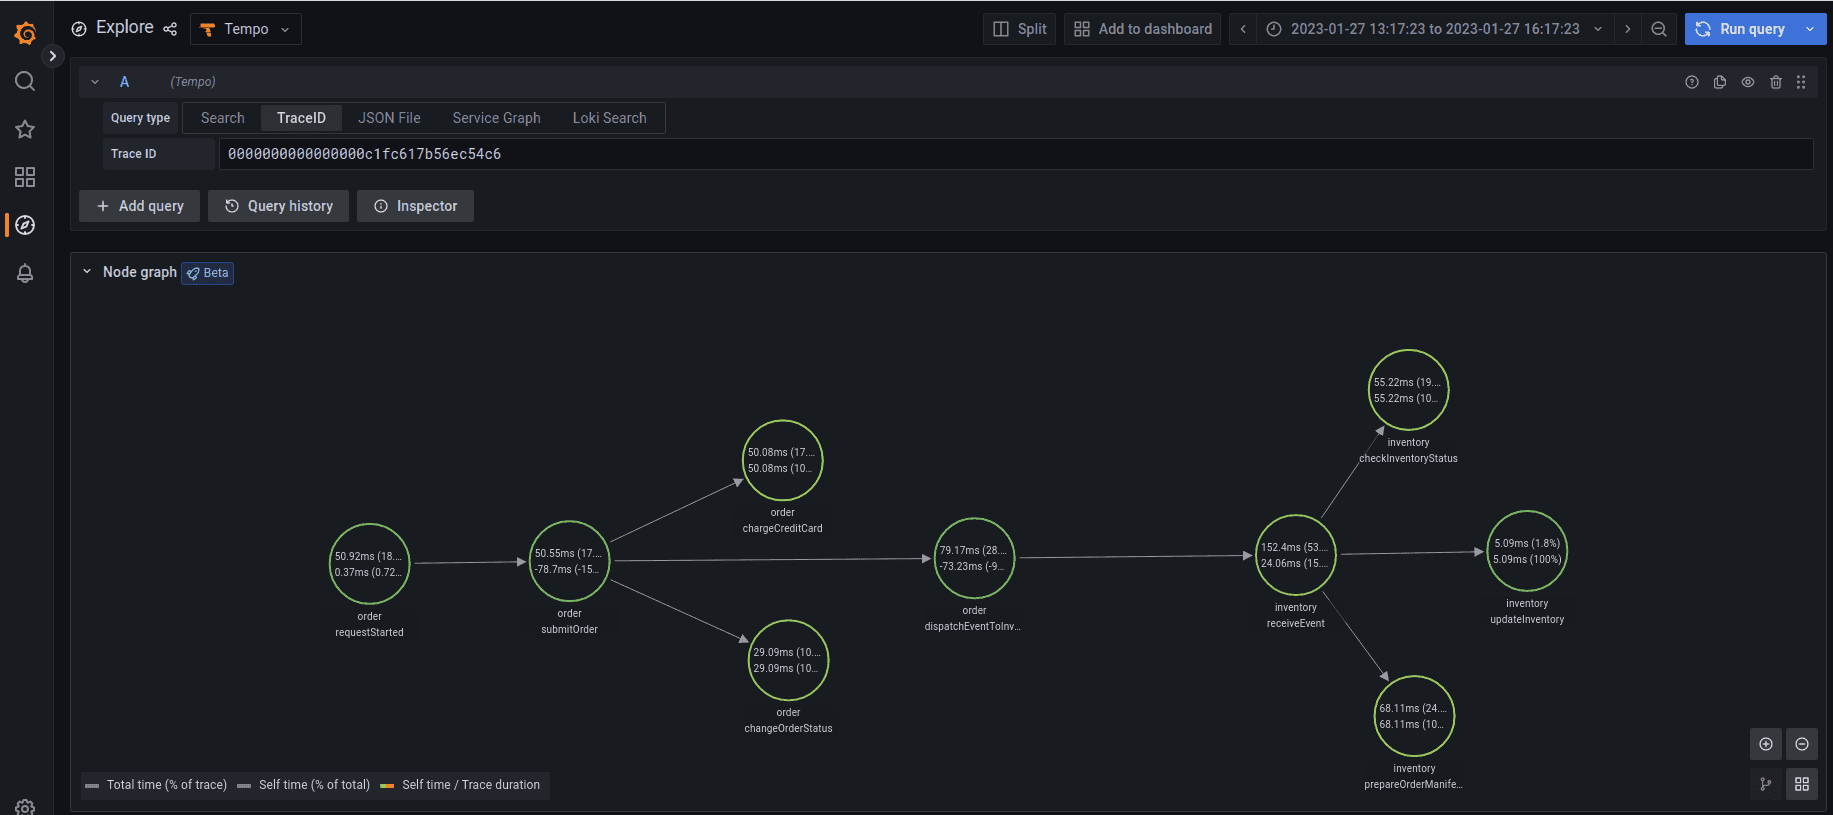
Once you find your trace, the node graph shows the graphical representation of its flow:
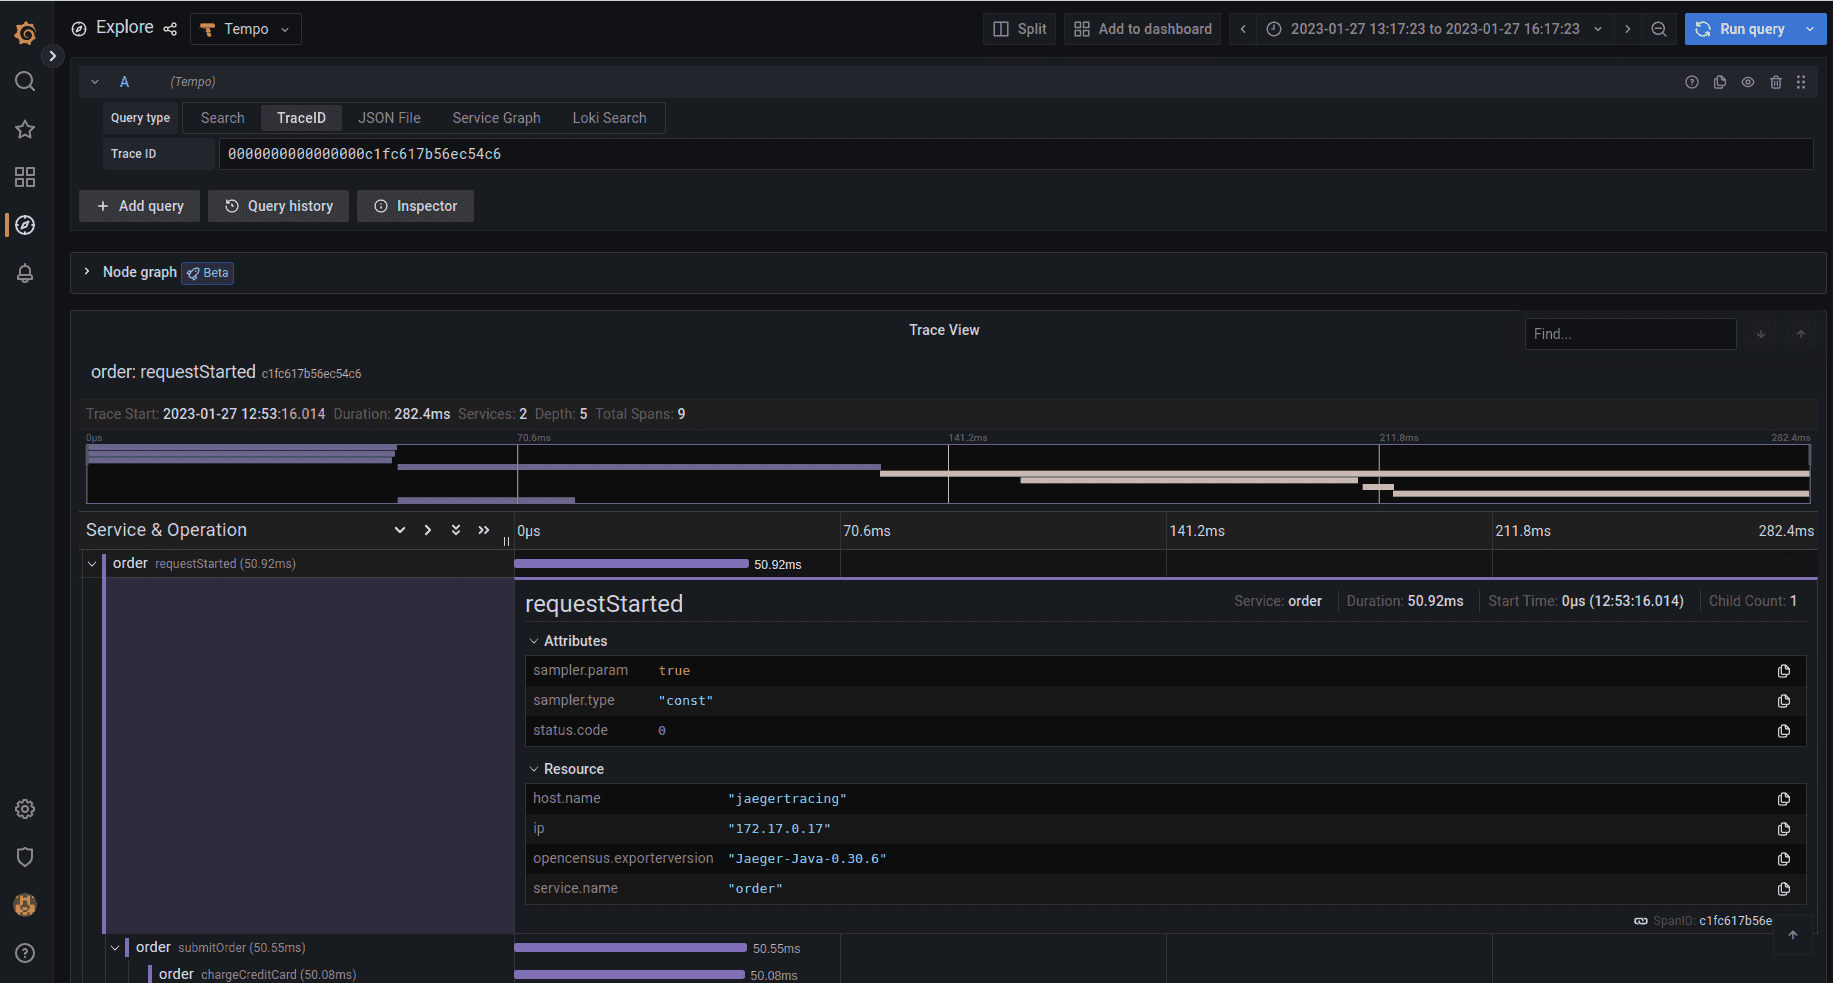
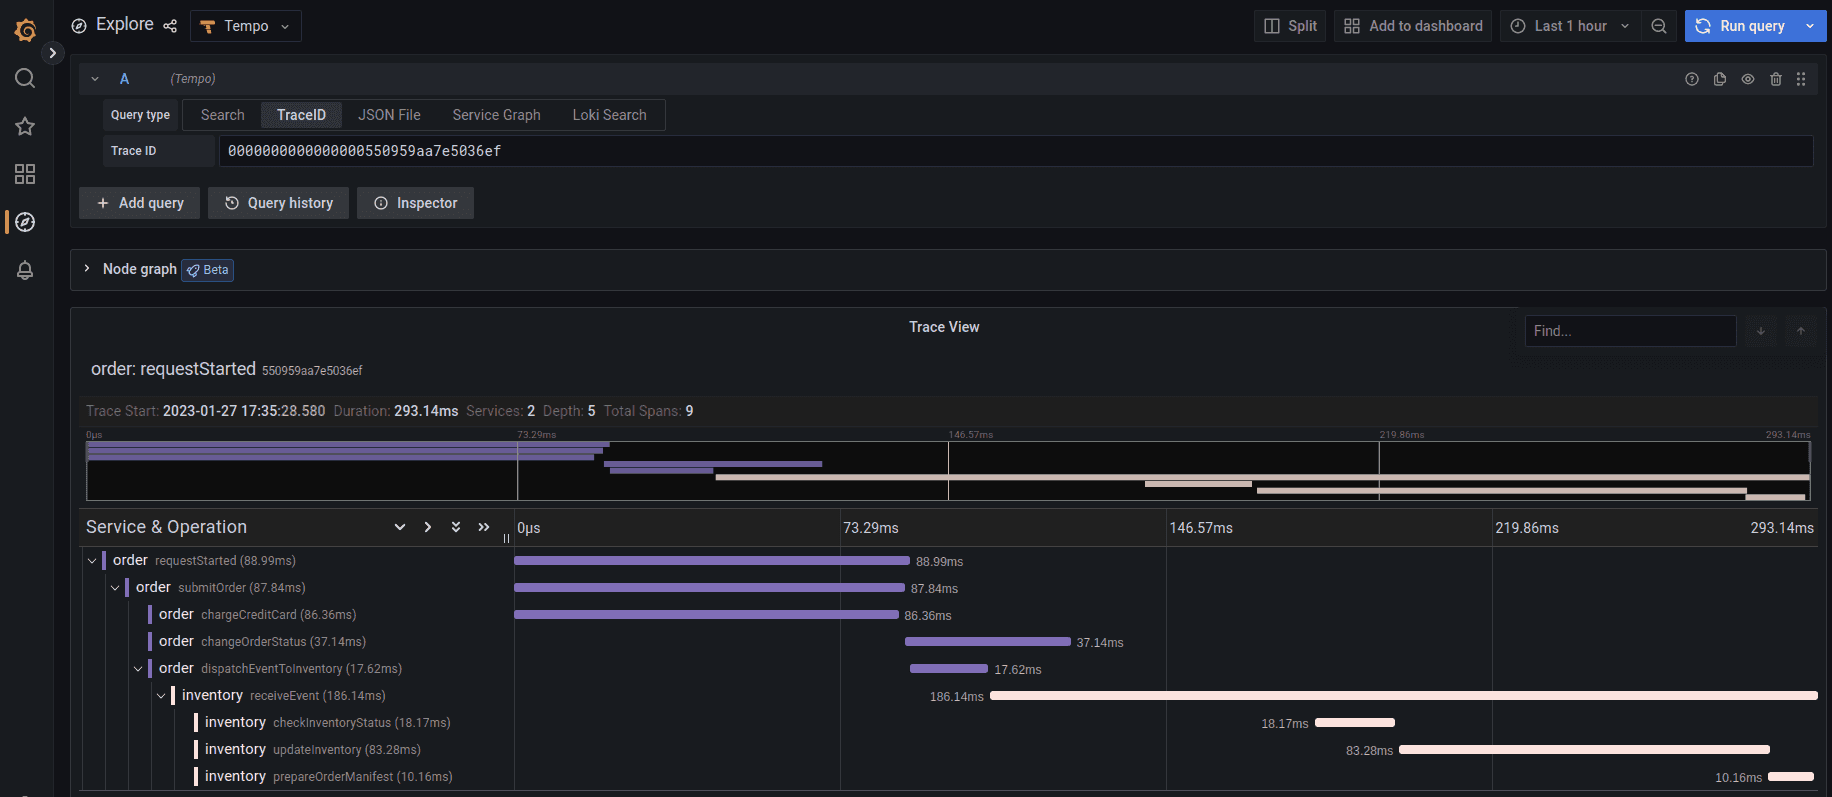
Tempo provides all details on all stages of the trace:
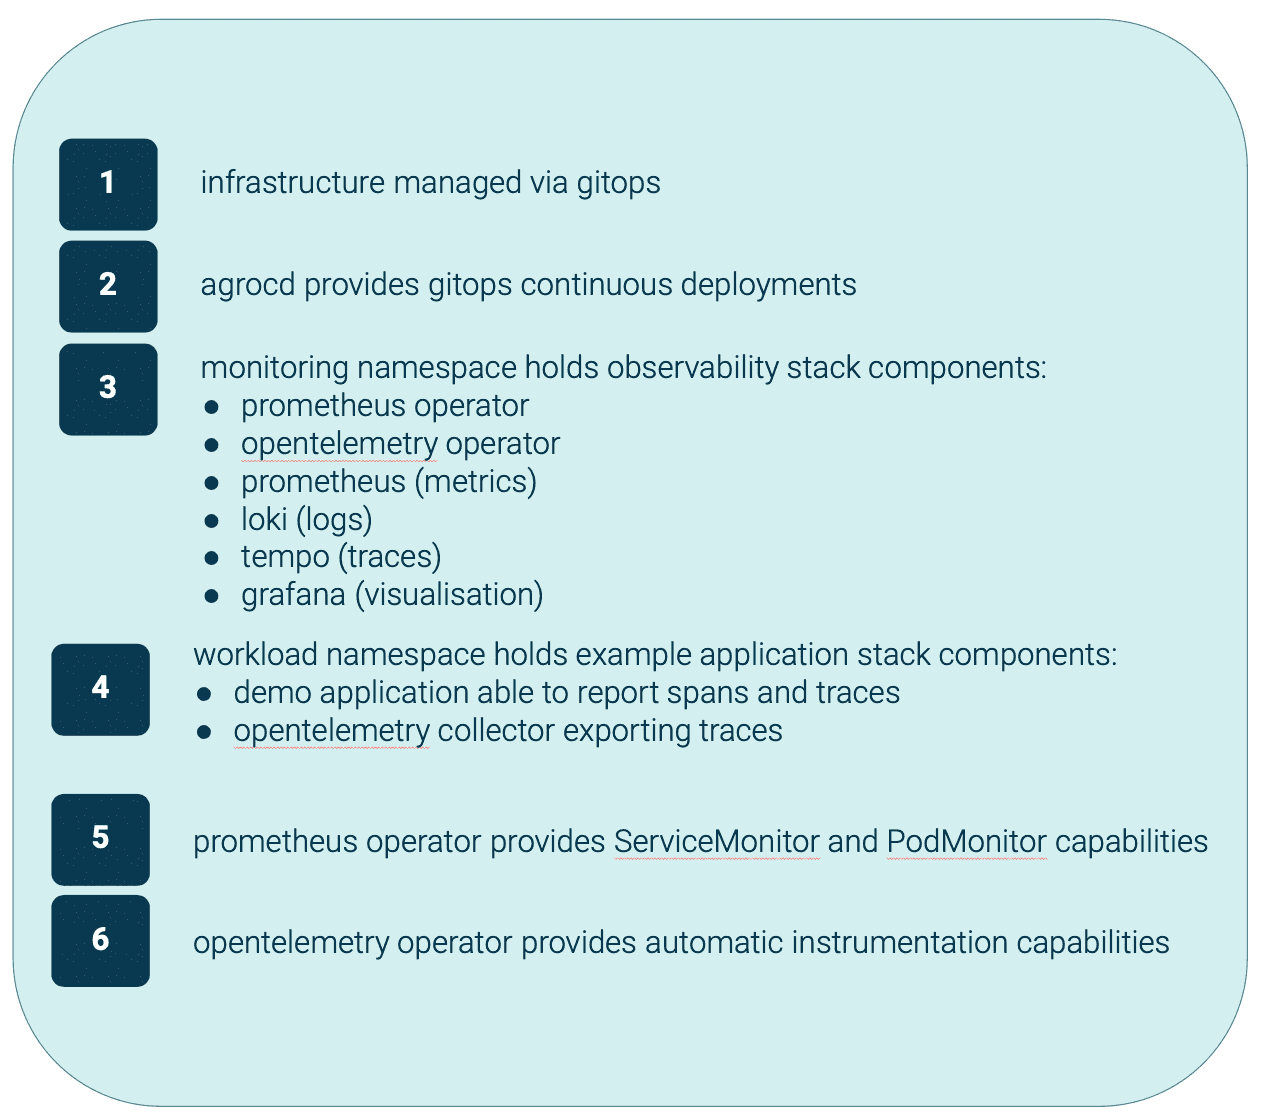
Prometheus operator provides ServiceMonitor and PodMonitor capabilities.
It automatically configures metrics endpoints for your applications:
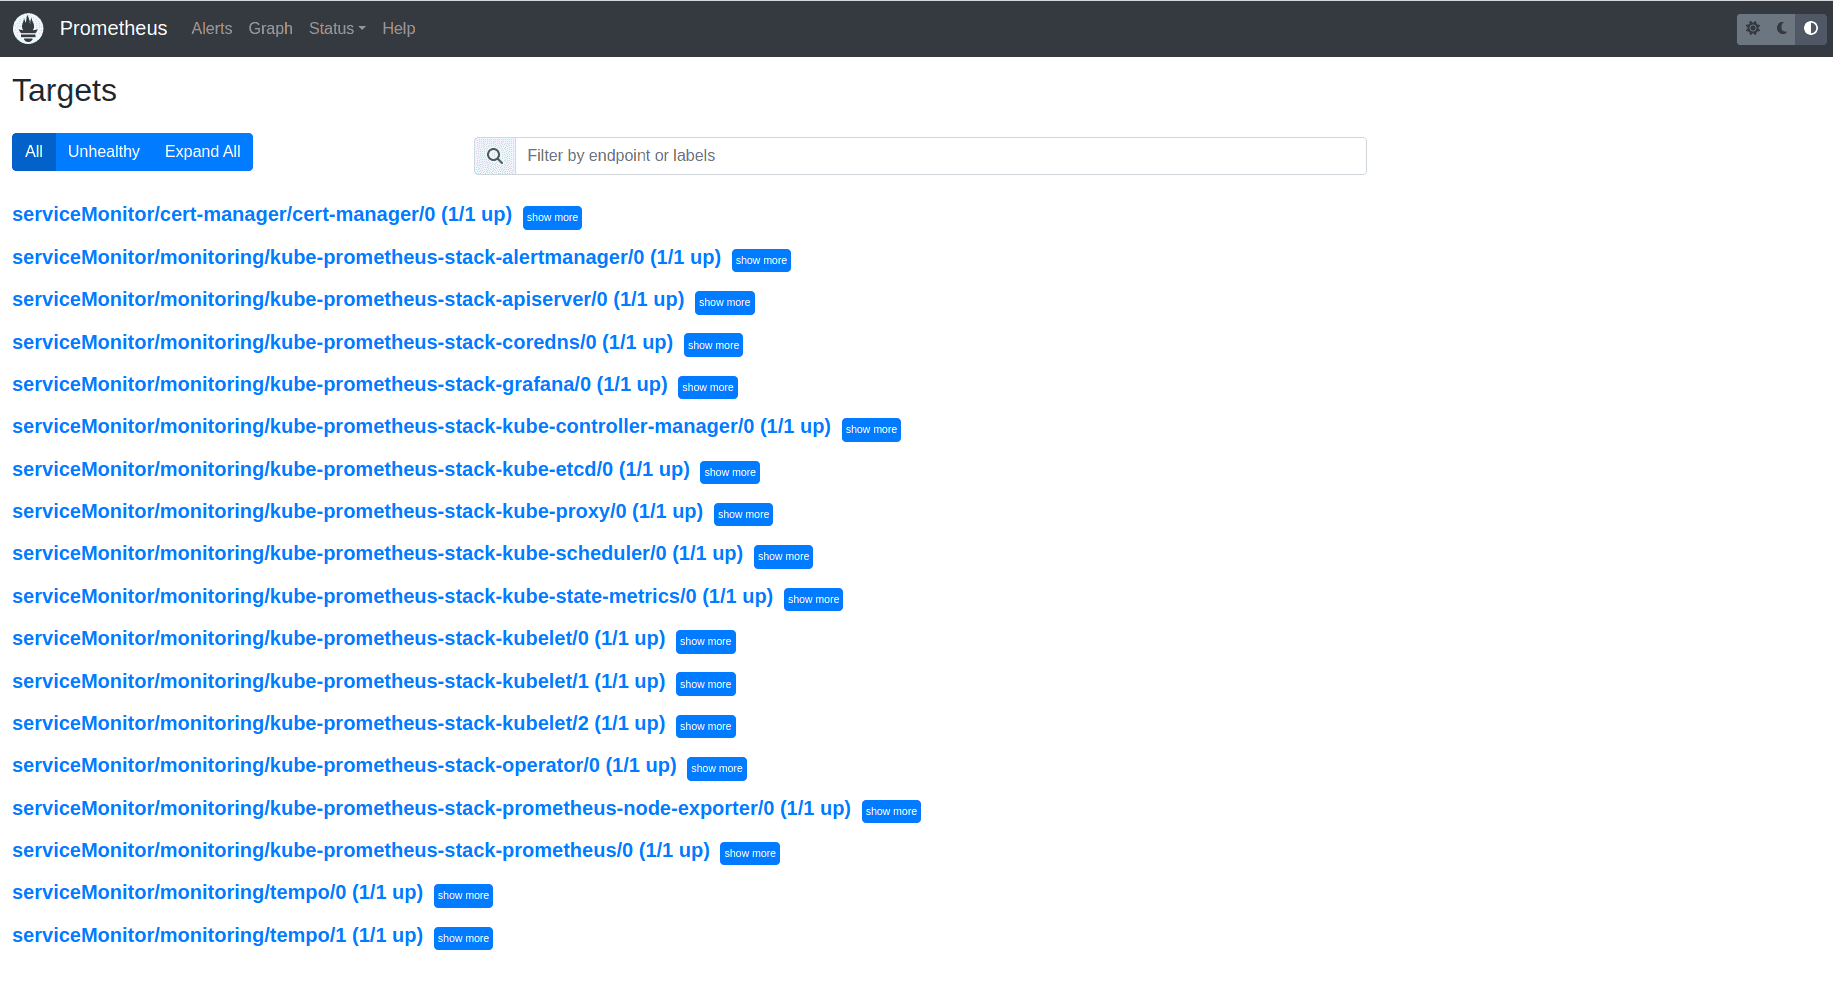
You can then focus on your dashboards and metrics instead of configuring them:
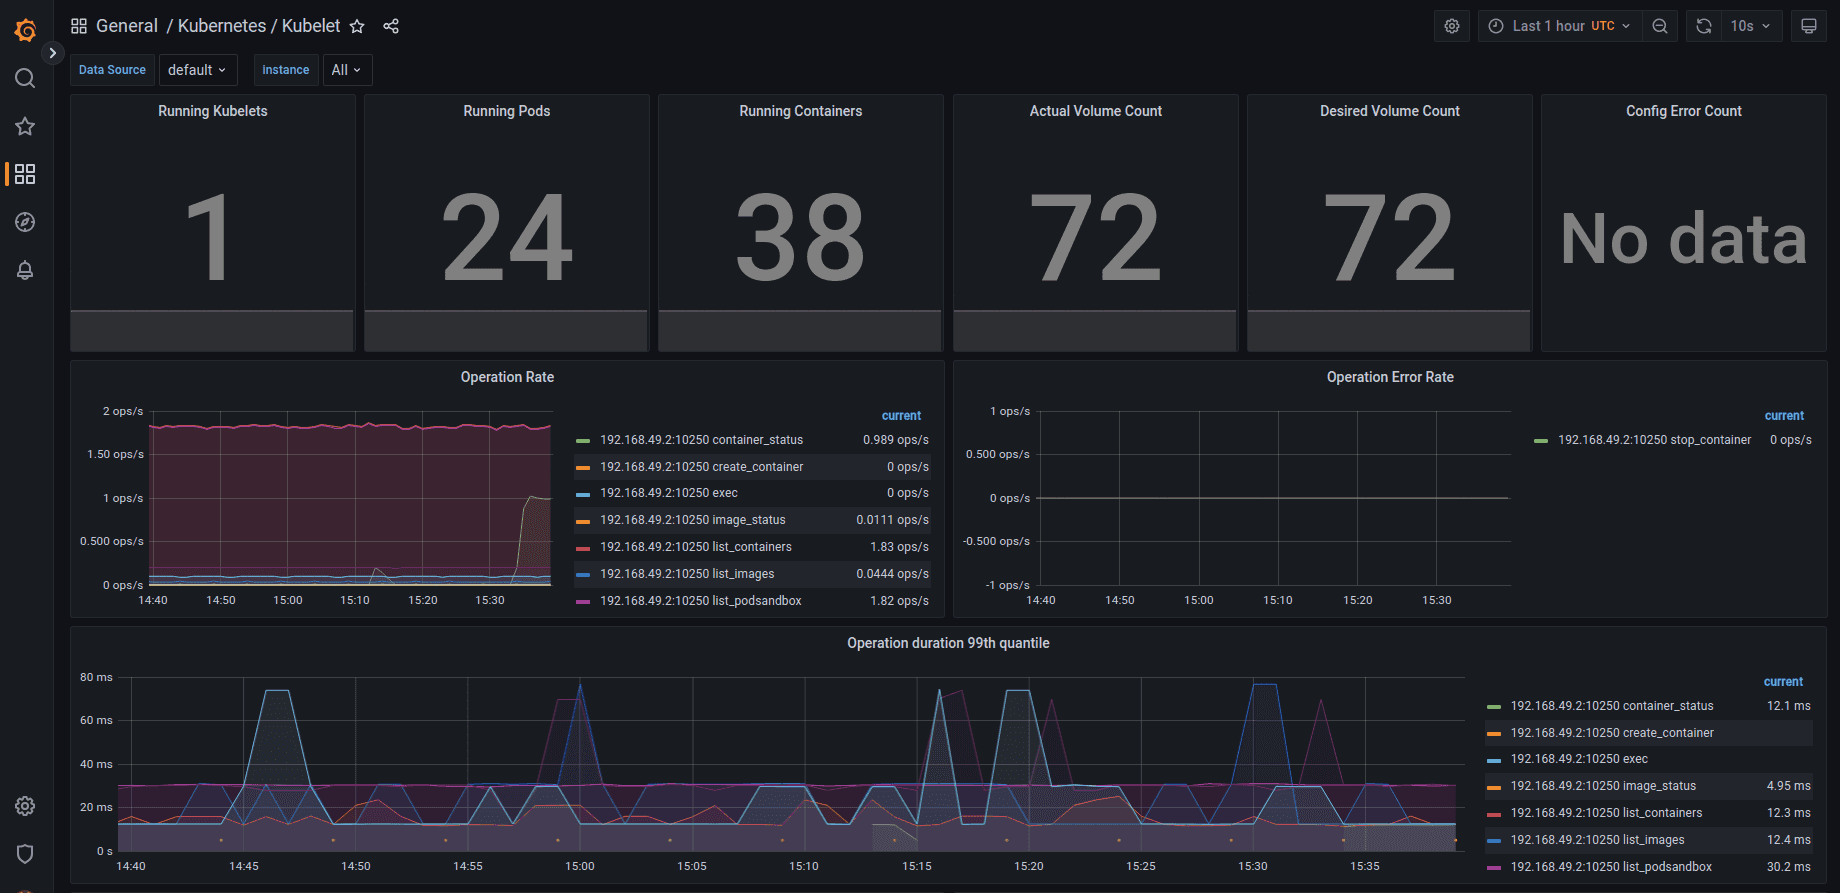
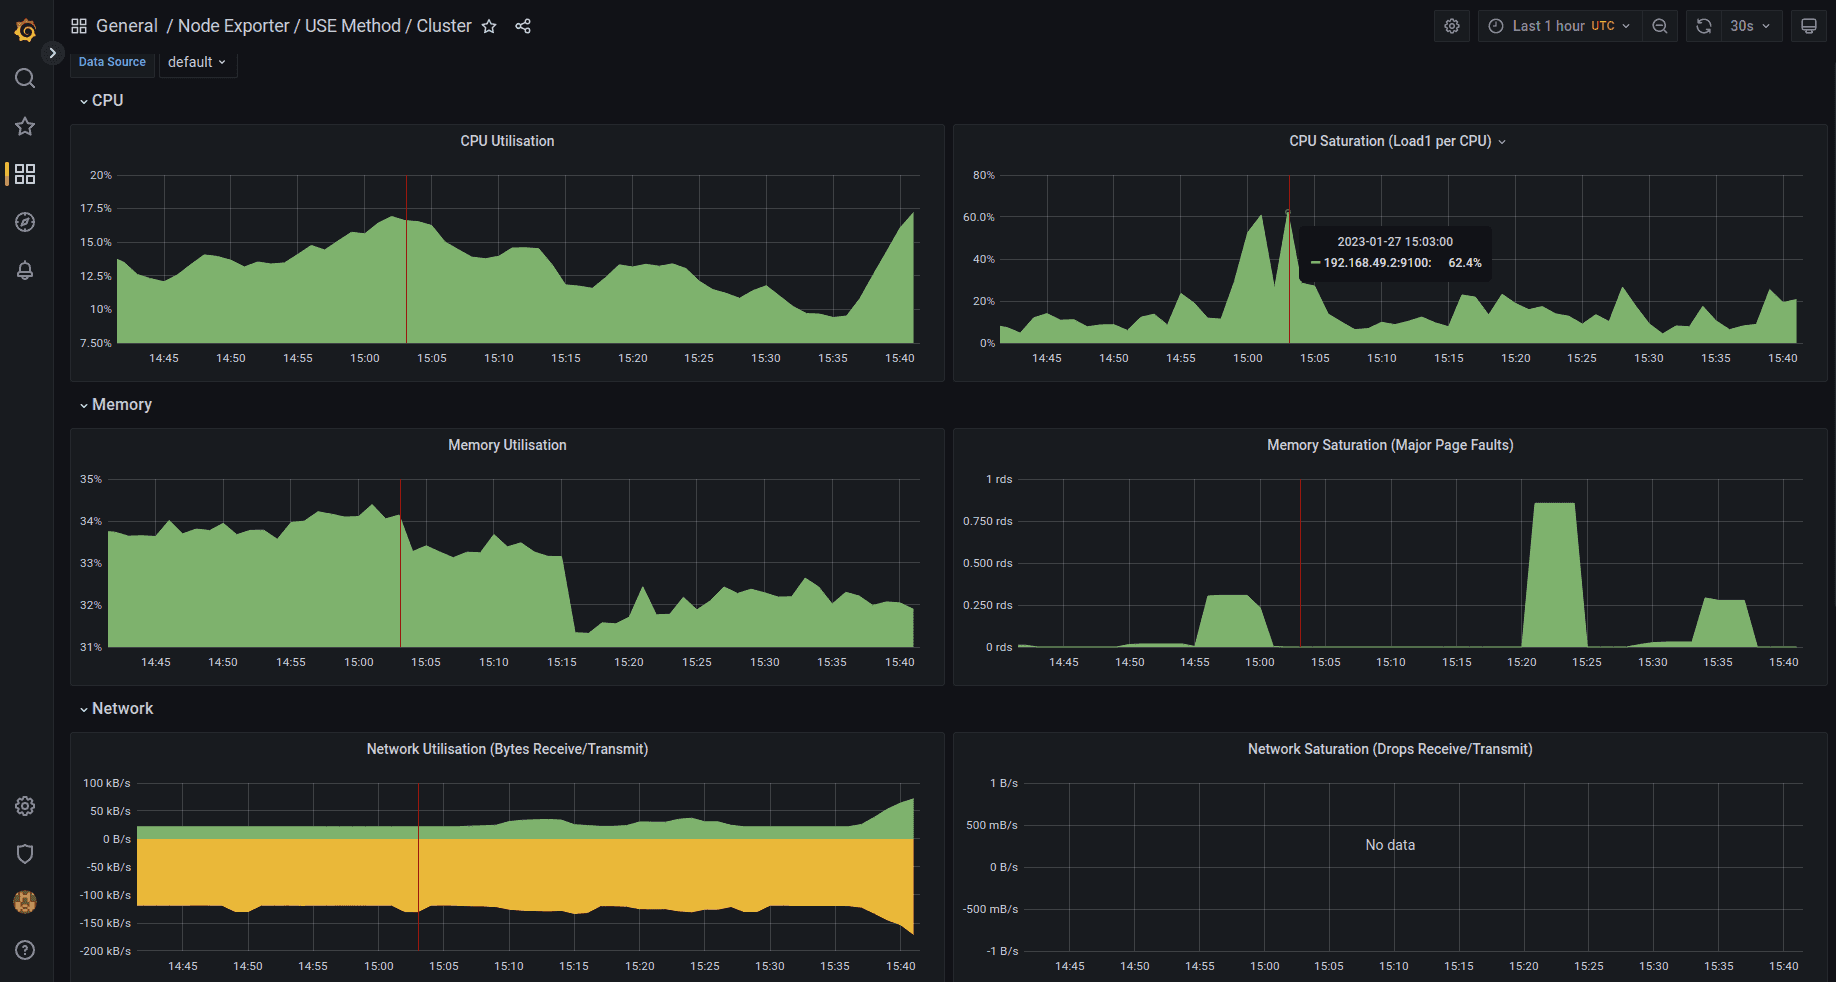
The OpenTelemetry operator provides automatic instrumentation for your applications.
For .Net, Java, NodeJS and Python you can get metrics, logs and traces without changing your application code.
Operator injects related collector configuration as a side container to your pods serving your workloads.
As shown in the Architecture diagrams, the collector can receive traces, metrics and logs and export them to our monitoring stack components.
In our case we configured the collector to receive traces from the jaegertracing pod and export them via the OTLP protocol towards tempo instance:
apiVersion: opentelemetry.io/v1alpha1
kind: OpenTelemetryCollector
metadata:
  name: sidecar-jaeger2tempo
spec:
  mode: sidecar
  config: |
    receivers:
      jaeger:
        protocols:
          thrift_compact:
    processors:
      batch:
    exporters:
      logging:
        loglevel: debug
      otlphttp:
        endpoint: http://tempo.monitoring.svc.cluster.local:4318
    service:
      pipelines:
        traces:
          receivers: [jaeger]
          processors: [batch]
          exporters: [logging, otlphttp]
Then all we need to do is to annotate our application pod in a proper way:
apiVersion: v1
kind: Pod
metadata:
  name: jaegertracing
  annotations:
    sidecar.opentelemetry.io/inject: "true"
spec:
  containers:
  - name: myapp
    image: jaegertracing/vertx-create-span:operator-e2e-tests
    env:
    ports:
      - containerPort: 8080
        protocol: TCP
Once deployed, we can confirm in the OpenTelemetry operator logs the creation of the collector:
{"level":"info","ts":1674809899.2073207,"msg":"Starting workers","controller":"opentelemetrycollector","controllerGroup":"opentelemetry.io","controllerKind":"OpenTelemetryCollector","worker count":1}
{"level":"info","ts":1674812036.5120418,"logger":"opentelemetrycollector-resource","msg":"default","name":"sidecar-jaeger2tempo"}
{"level":"info","ts":1674812036.5131807,"logger":"opentelemetrycollector-resource","msg":"validate create","name":"sidecar-jaeger2tempo"}
{"level":"info","ts":1674812190.6536167,"msg":"truncating container port name","port.name.prev":"jaeger-thrift-compact","port.name.new":"jaeger-thrift-c"}
Our pod now has an additional container - otc-container handling OpenTelemetry functionalities:
Name:         jaegertracing
Namespace:    workload
{output omitted}
Labels: sidecar.opentelemetry.io/injected=workload.sidecar-jaeger2tempo
Annotations:  sidecar.opentelemetry.io/inject: true
{output omitted}
Containers:
  myapp:
{output omitted}
  otc-container:
{output omitted}
    Environment:
      POD_NAME:                            jaegertracing (v1:metadata.name)
      OTEL_RESOURCE_ATTRIBUTES_POD_NAME:   jaegertracing (v1:metadata.name)
      OTEL_RESOURCE_ATTRIBUTES_POD_UID:     (v1:metadata.uid)
      OTEL_RESOURCE_ATTRIBUTES_NODE_NAME:   (v1:spec.nodeName)
      OTEL_RESOURCE_ATTRIBUTES:            k8s.namespace.name=workload,k8s.node.name=$(OTEL_RESOURCE_ATTRIBUTES_NODE_NAME),k8s.pod.name=$(OTEL_RESOURCE_ATTRIBUTES_POD_NAME),k8s.pod.uid=$(OTEL_RESOURCE_ATTRIBUTES_POD_UID)
Let’s trigger some spans and traces via port forwarded jaegertracing pod:
curl localhost:8080
Hello from Vert.x!

kubectl logs -n workload jaegertracing otc-container --tail 31
Span #1
    Trace ID       : 0000000000000000550959aa7e5036ef
    Parent ID      : 419eda90943e0c03
    ID             : 9fbf508e23daf440
    Name           : updateInventory
    Kind           : Unspecified
    Start time     : 2023-01-27 16:35:28.779 +0000 UTC
    End time       : 2023-01-27 16:35:28.862282 +0000 UTC
    Status code    : Unset
    Status message :
Span #2
    Trace ID       : 0000000000000000550959aa7e5036ef
    Parent ID      : 419eda90943e0c03
    ID             : b381d2aea988a42c
    Name           : prepareOrderManifest
    Kind           : Unspecified
    Start time     : 2023-01-27 16:35:28.862 +0000 UTC
    End time       : 2023-01-27 16:35:28.872162 +0000 UTC
    Status code    : Unset
    Status message :
Span #3
    Trace ID       : 0000000000000000550959aa7e5036ef
    Parent ID      : fdbf8f7955900271
    ID             : 419eda90943e0c03
    Name           : receiveEvent
    Kind           : Unspecified
    Start time     : 2023-01-27 16:35:28.687 +0000 UTC
    End time       : 2023-01-27 16:35:28.873144 +0000 UTC
    Status code    : Unset
    Status message :
We can now confirm that the above traces are visible in Tempo:
Let me highlight once more the benefits from achieving deep observability:
In GetInData we know that already and now after reading this post you know it too.
In the second part of the observability series: ‘Observability on Grafana - lessons learned’ I will walk you through our insight from our use cases that we encountered and what we’ve learned like: how to choose reliable, feature rich tools able to support multiple architectures, or that configuration changes should be verified and applied automatically.
Hardly anyone needs convincing that the more a data-driven company you are, the better. We all have examples of great tech companies in mind. The…
Read moreIntro Machine Learning is now used by thousands of businesses. Its ubiquity has helped to drive innovations that are increasingly difficult to predict…
Read moreA tutorial on how to deploy one of the key pieces of the MLOps-enabling modern data platform: the Feature Store on Azure Databricks with Terraform as…
Read moreMulti-tenant architecture, also known as multi-tenancy, is a software architecture in which a single instance of software runs on a server and serves…
Read moreStreaming analytics is no longer just a buzzword—it’s a must-have for modern businesses dealing with dynamic, real-time data. Apache Flink has emerged…
Read moreIt's coming up to a year since the European Commission published its proposal for the Artificial Intelligence Act (the AI Act/AI Regulation). The…
Read moreTogether, we will select the best Big Data solutions for your organization and build a project that will have a real impact on your organization.
What did you find most impressive about GetInData?