Power of Big Data: Sales
In the first part of the series "Power of Big Data", I wrote about how Big Data can influence the development of marketing activities and how it can…
Read moreData Studio is a reporting tool that comes along with other Google Cloud Platform products to bring out a simple yet reliable BI platform. There are multiple connectors available, but a tandem with BigQuery is probably the most powerful combination. Since Google Data Studio is free of charge, we might get an impression we can run reports without worrying about costs or performance. Well, that is just partially true, as it is BigQuery who does the heavy lifting part. Let’s check out how the brain steers the muscle.
In this article we will address two important questions each organization using Data Studio + BigQuery will face sooner or later:
How much content in Data Studio is created and how it is being used?
What is the actual cost of using Data Studio on top of BigQuery and how to pay less?
Keep on reading to learn more about Data Studio’s auditing and find out some best practices of cost control if your data sits in BigQuery. We will uncover some insight using Data Studio audit log and BigQuery INFORMATION_SCHEMA for jobs. We will connect to public datasets so you can easily test at your end.
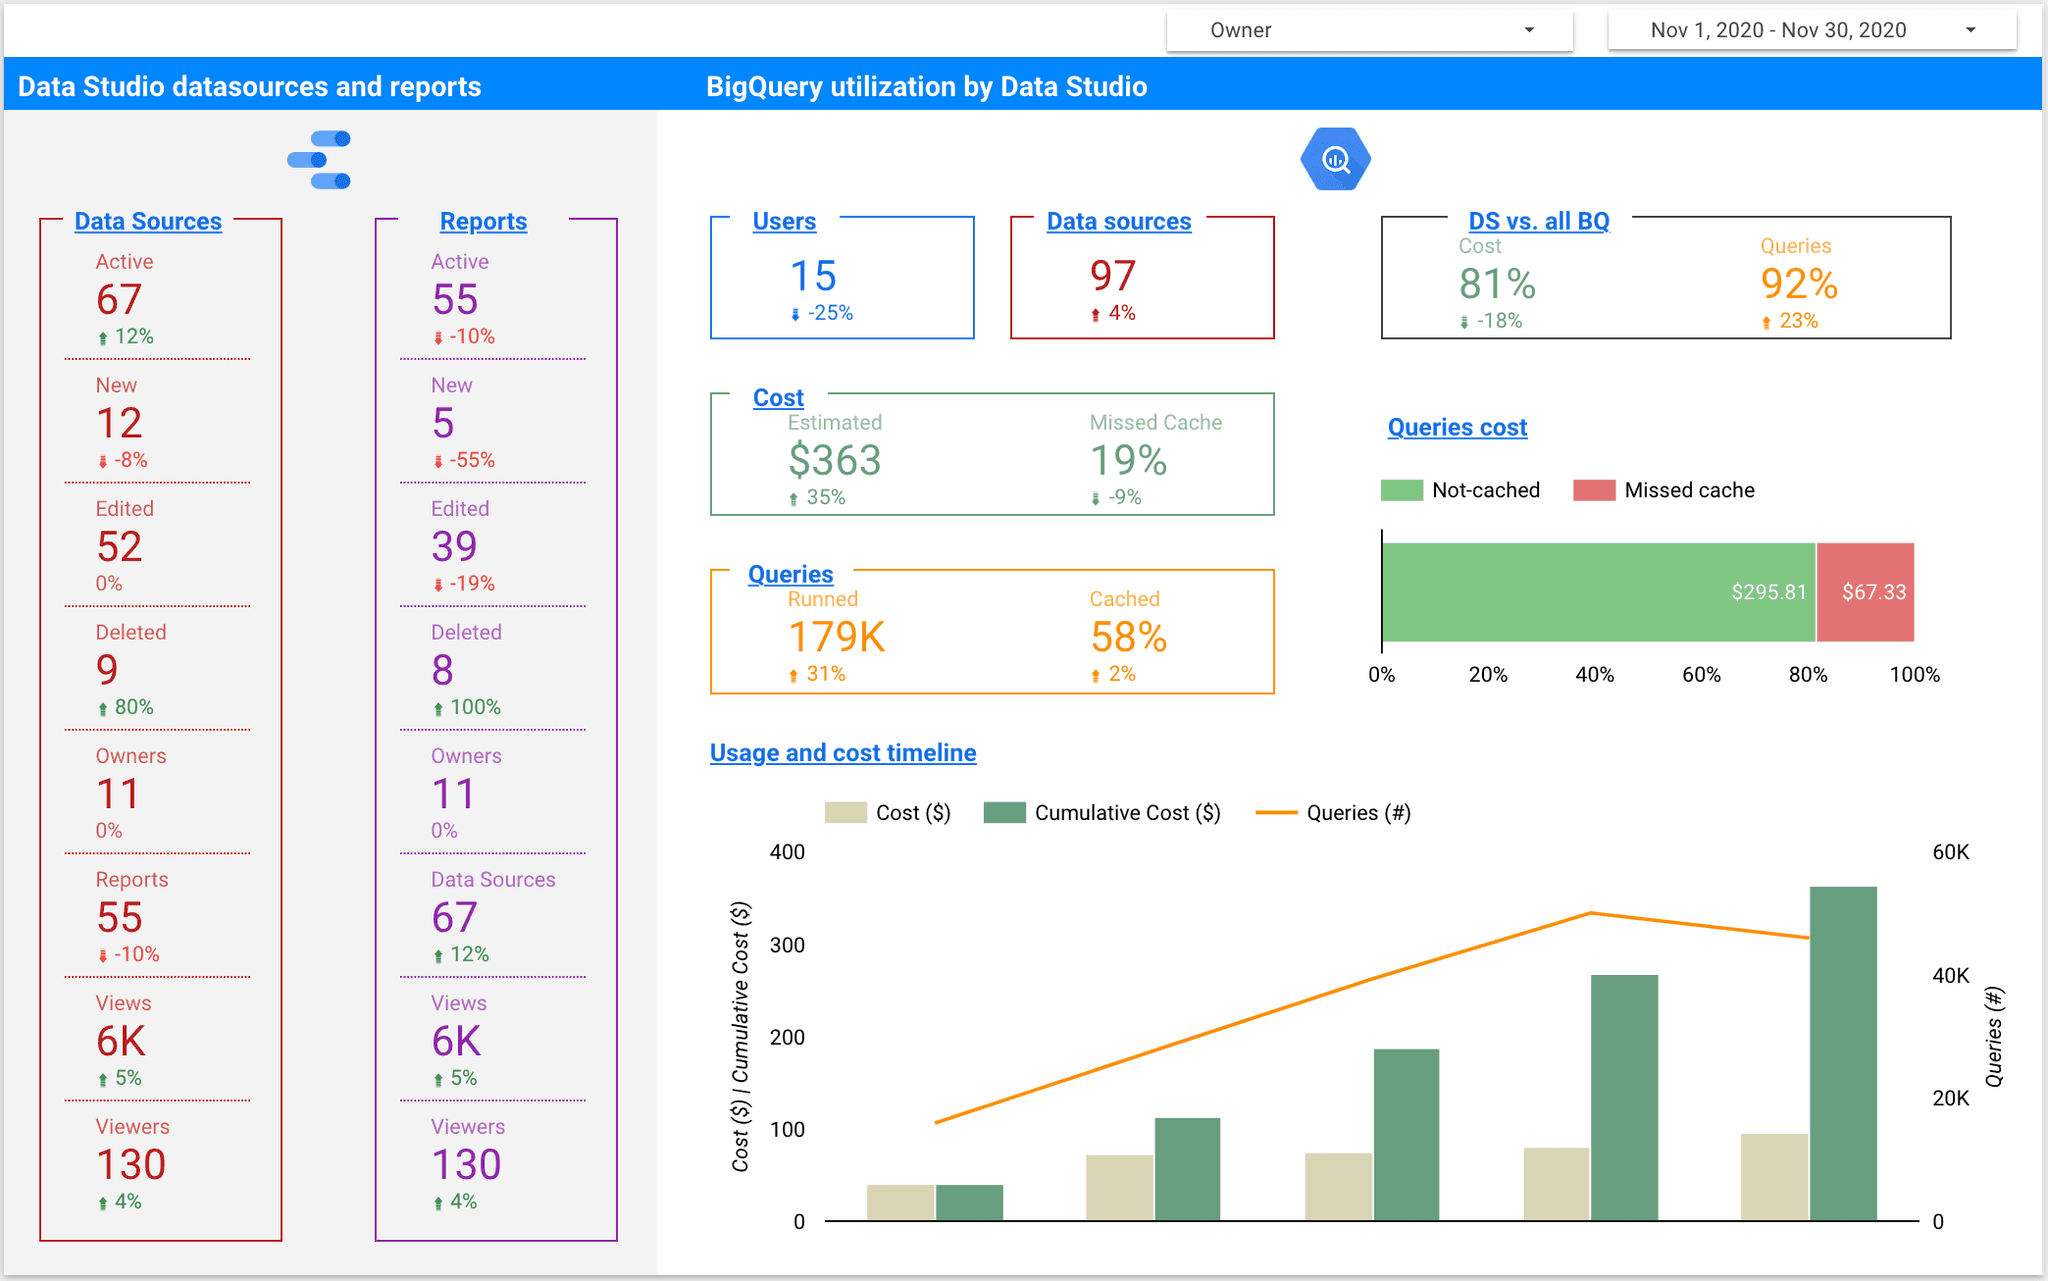
Before we make any judgement on how Data Studio utilizes BigQuery’s data we need to be able to track more data, or actually metadata. In mid 2020 an audit log for Data Studio was introduced, which is a milestone change. Up to the release, content management required a lot of effort and self discipline from all report creators in the organization. Now we can identify all assets created in Data Studio, together with ownership and event based user’s action log.

The audit log is available to Google Workspace accounts only (personal @gmail.com are not eligible) and can be downloaded into Sheets per request or an automated load into BigQuery can be set up by a Google Admin (Enterprise and Education Plus editions only). While the log is a great feature and a huge step towards transparency of tool’s usage, it lacks a lineage to BigQuery jobs that stand behind generated requests. To get this insight we can use either Cloud Audit Logs or INFORMATION_SCHEMA metadata. Both options answer the questions of who, what, when and how much, but the INFORMATION_SCHEMA doesn’t require any set up and is easier to use (Google analytics option is available, too). All we need to do now is isolate Google Data Studio requests from all the rest.

Now that we know how to get the metadata, we need to isolate Data Studio’s requests and identify different types of actions they originated from. While charts are the core of any BI tool, they don’t stand alone. We need to connect the datasource first, and then manipulate it with filters and interactions.

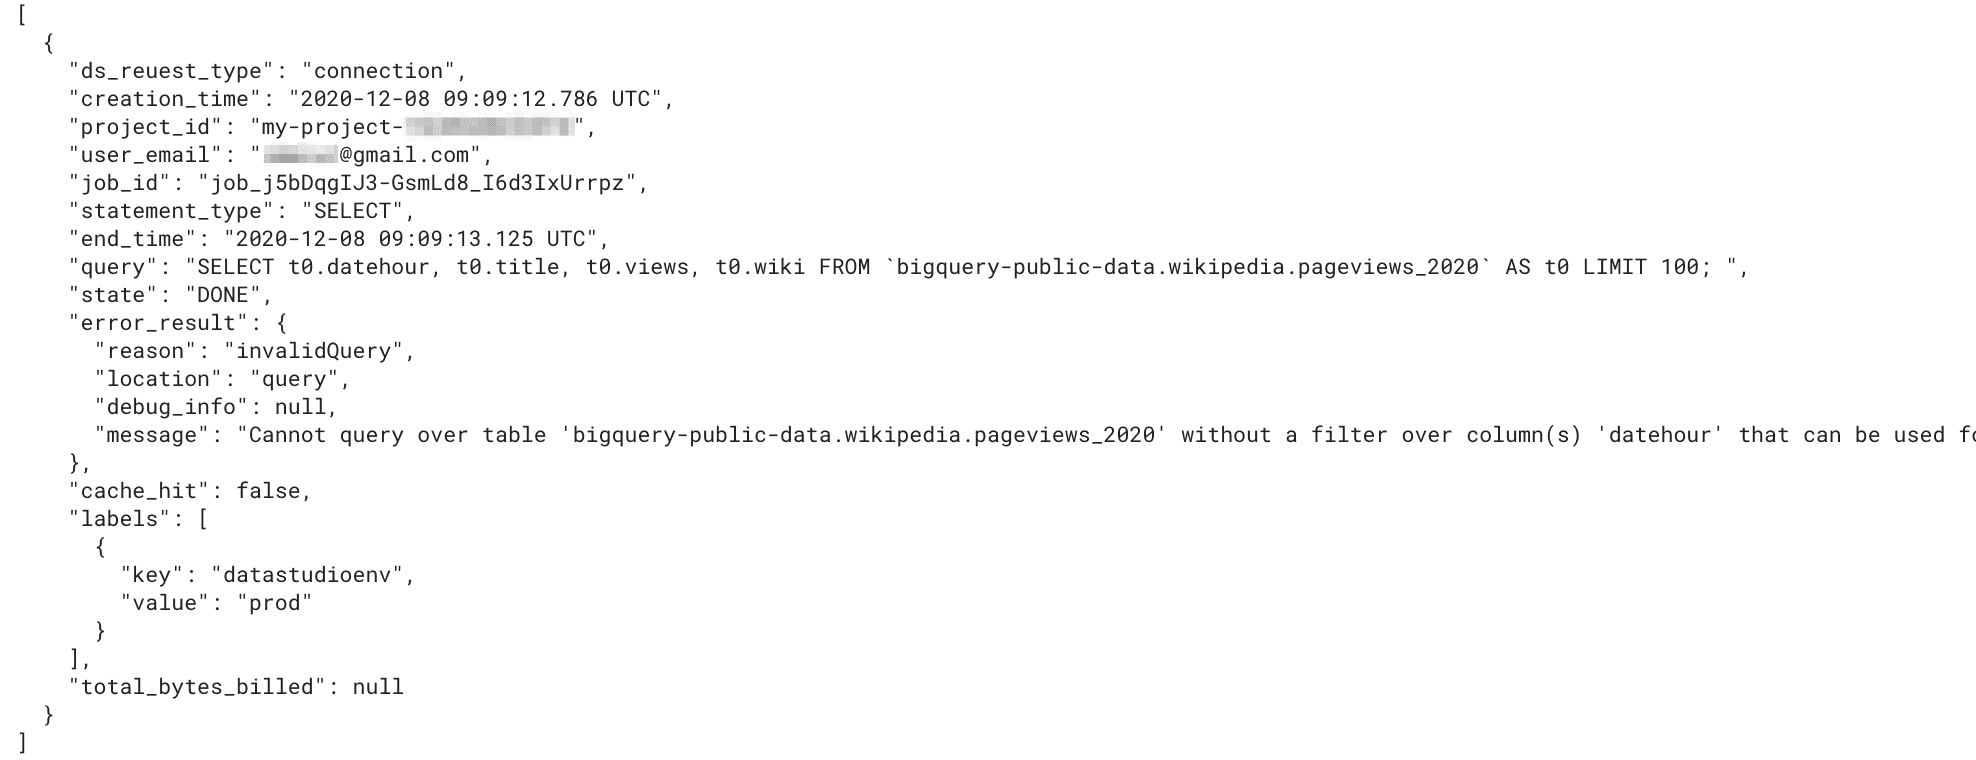


We can easily spot the patterns for Data Studio generated queries:
`t0` alias for the datasource,`clmn[:digit:]_` aliases for columns,`LIMIT 100` for connection and `LIMIT 20000000` for charts and filters.It is fairly safe to assume nobody writes queries like that. Using REGEXP to separate Data Studio’s request from all the rest should not be an issue now:

You may wonder if this covers all the requests Data Studio generates. Well, it doesn’t. We are missing a Custom Query connection request. Let’s check it out:


Instead of a single request, Google Data Studio generates two (or more) for a Custom Query connection. While the second one meets the pattern, the first one looks more human-written. There is no `clmn` or `t0`. There is `LIMIT 100;` however, but that is a bit too little to be sure it’s a Data Studio generated statement. Happily, there is a hint in the metadata we can follow instead.

Unless we use “datastudiodev” label for any other datasource or service, we can be sure the statement is a connection request, generated by Data Studio to get the underlying schema, no matter if it’s a direct link or a custom query connection. This is actually a great piece! And if only Google guys did it for all the Data Studio’s requests, we wouldn’t bother with the REGEXP at all. It would be even more useful with additional keys like “datasourceid”, “reportid”, “pageid” and “userid” (the one we have in metadata is data source owner, not the viewer). Going even further, there could be a link to a matching row in the Data Studio audit log we discussed earlier. Enriching labels with this additional metadata would bring the detailed control over Data Studio usage we are so missing now! But for now we need to stick to labels and REGEXP capabilities as they are.
In order to measure BigQuery usage we need to separate queries even further - by a request type. While labels do the job for connection type, we need to go for some kind of compromise to distinguish ‘filter’ requests (e.g. to get values for a drop-down filter) from ‘chart’ ones. Filter requests can look exactly the same as single dimension chart ones. For those there is no other way and we need to make a single call: will we classify them as a filter or a chart. Personally, I prefer the ‘filter’ option since there are not so many single dimension charts created. As long as single-dimension charts are not the majority in your organization, you can probably do the same.
CREATE OR REPLACE VIEW ds_usage.v_jobs_by_project
AS
-- NOTE: partitioned by the creation_time column and clustered by project_id and user_email
SELECT
  CASE
    WHEN EXISTS (SELECT TRUE FROM UNNEST(labels) AS label WHERE label.key = "datastudioenv") THEN "connection"
    WHEN REGEXP_CONTAINS(query, r'^SELECT \* FROM \(\nSELECT (clmn[0-9_]+, ){2}') THEN "chart" -- chart with at least two dimensions
    WHEN REGEXP_CONTAINS(query, r'^SELECT \* FROM \(\nSELECT clmn[0-9_]+') AND NOT REGEXP_CONTAINS(query, r'\) GROUP BY clmn[0-9_]+') THEN "chart" -- score card charts
    WHEN REGEXP_CONTAINS(query, r'(?s)^SELECT \* FROM \(\nSELECT clmn[0-9_]+.*LIMIT 20000000') THEN "filter" -- drop-down filter etc
    ELSE NULL
  END AS ds_reuest_type,
  * EXCEPT(referenced_tables, labels, timeline, job_stages) -- to have a flat result all repeated fields are excluded. You can add them using LEFT JOIN UNNEST
FROM
 `region-us`.INFORMATION_SCHEMA.JOBS_BY_PROJECT AS p -- mind the region
ORDER BY
creation_time DESC;Now we are ready to prepare the first charts for Data Studio on Google BigQuery usage and cost.
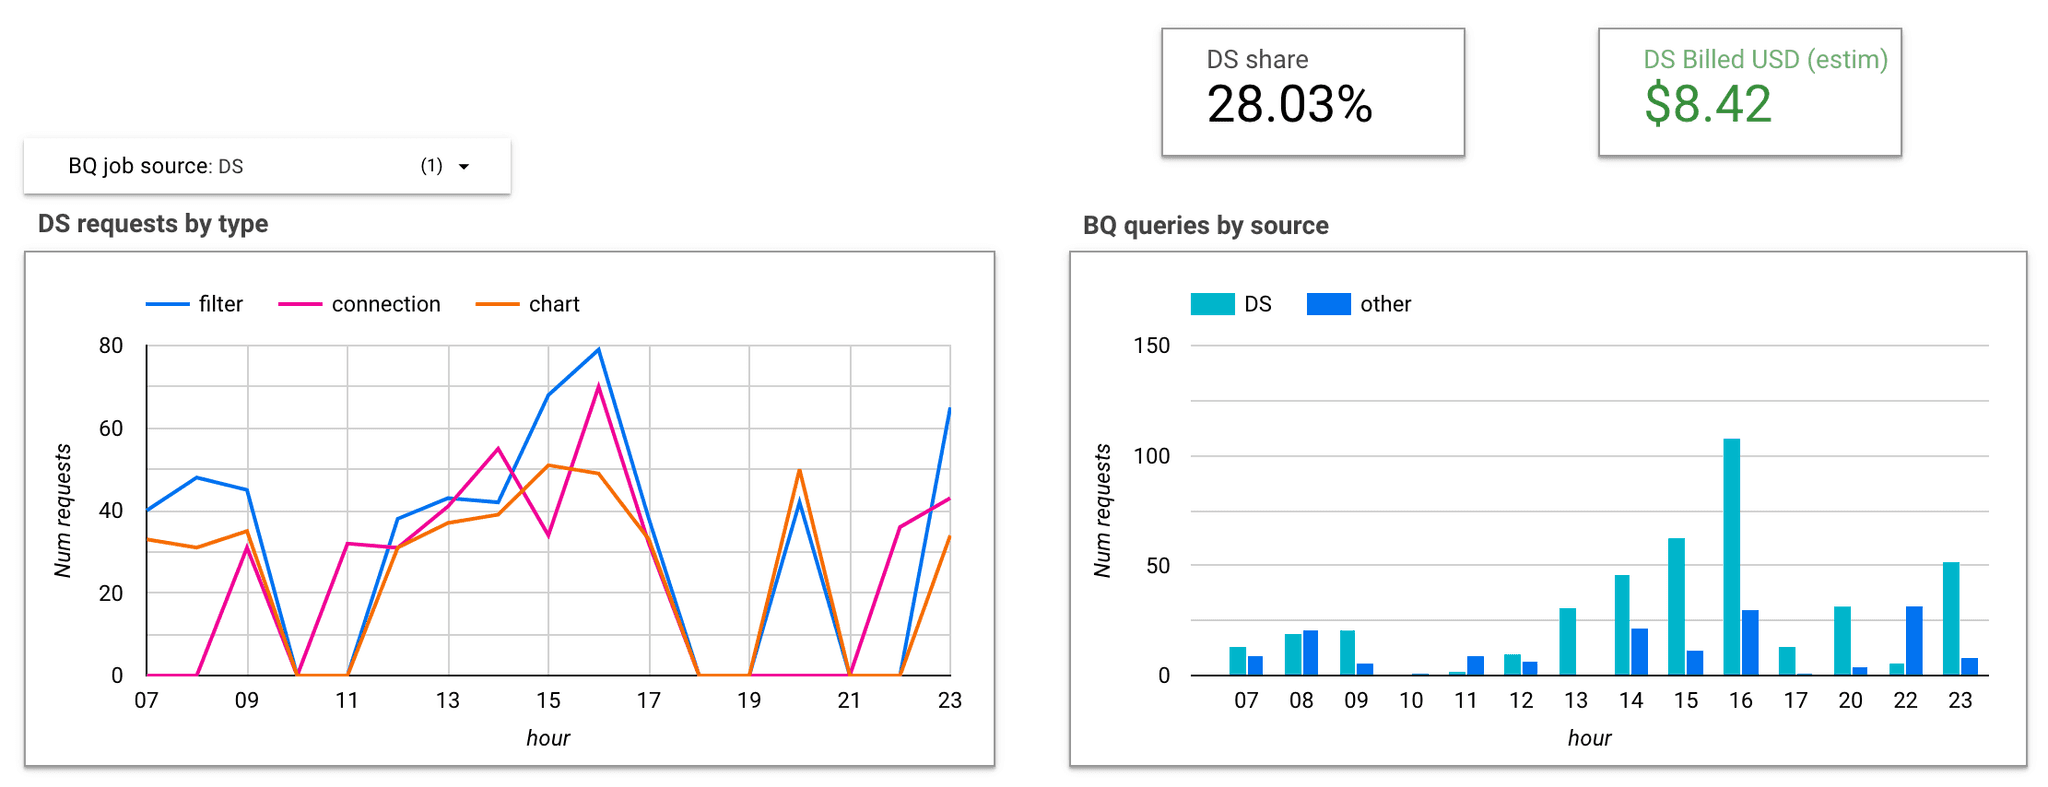
Having Data Studio’s requests filtered out and divided into 3 main categories gives us a possibility to look into details and identify cost and performance wastes that we should avoid in the future.
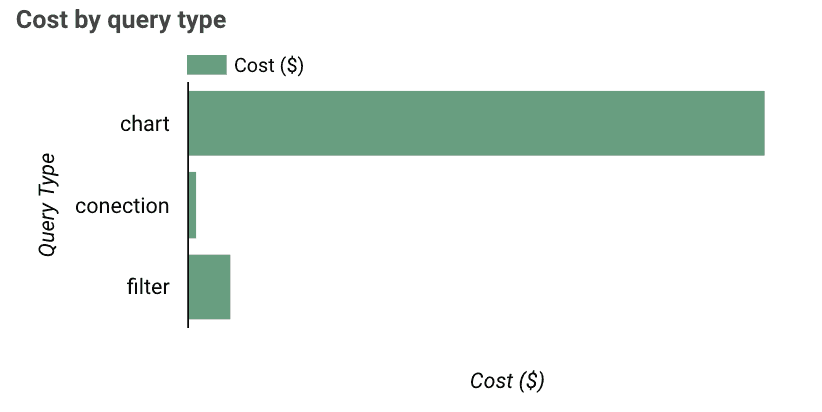
In one of our examples we saw a connection request that failed due to a missing partition filter.

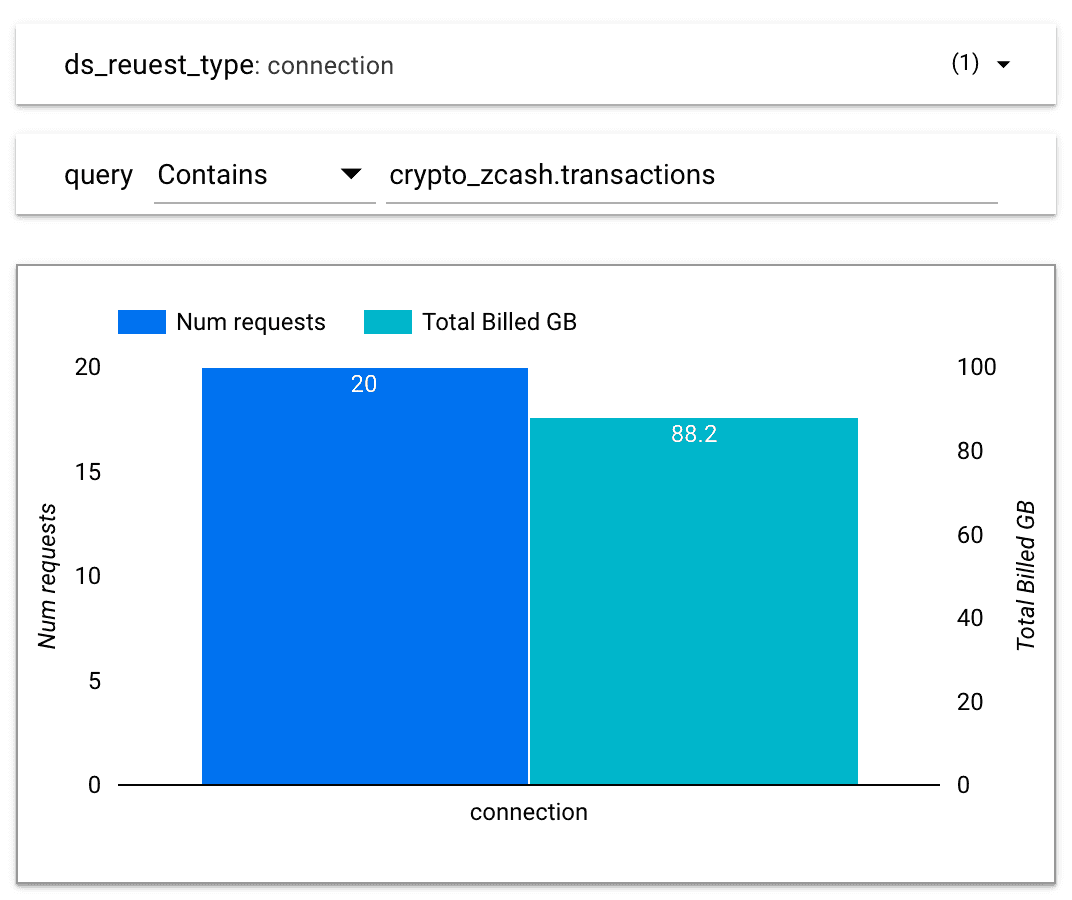
While there was an error on BigQuery side, Data Studio process went totally fine and the schema was retrieved in a second. This is the best we can get, a quick response for free. All thanks to partition_filter_required = true option. If we check top costly connection cases using the log we have, we will notice they are referencing big tables with this option set to false. Let’s take an example of connecting bigquery-public-data.crypto_zcash.transactions table. What we need to know about this particular table is that it is partitioned but filter not required, not clustered, and that it contains several repeated fields (nesting). We will be surprised how many requests Data Studio sends out to get the schema from BigQuery:
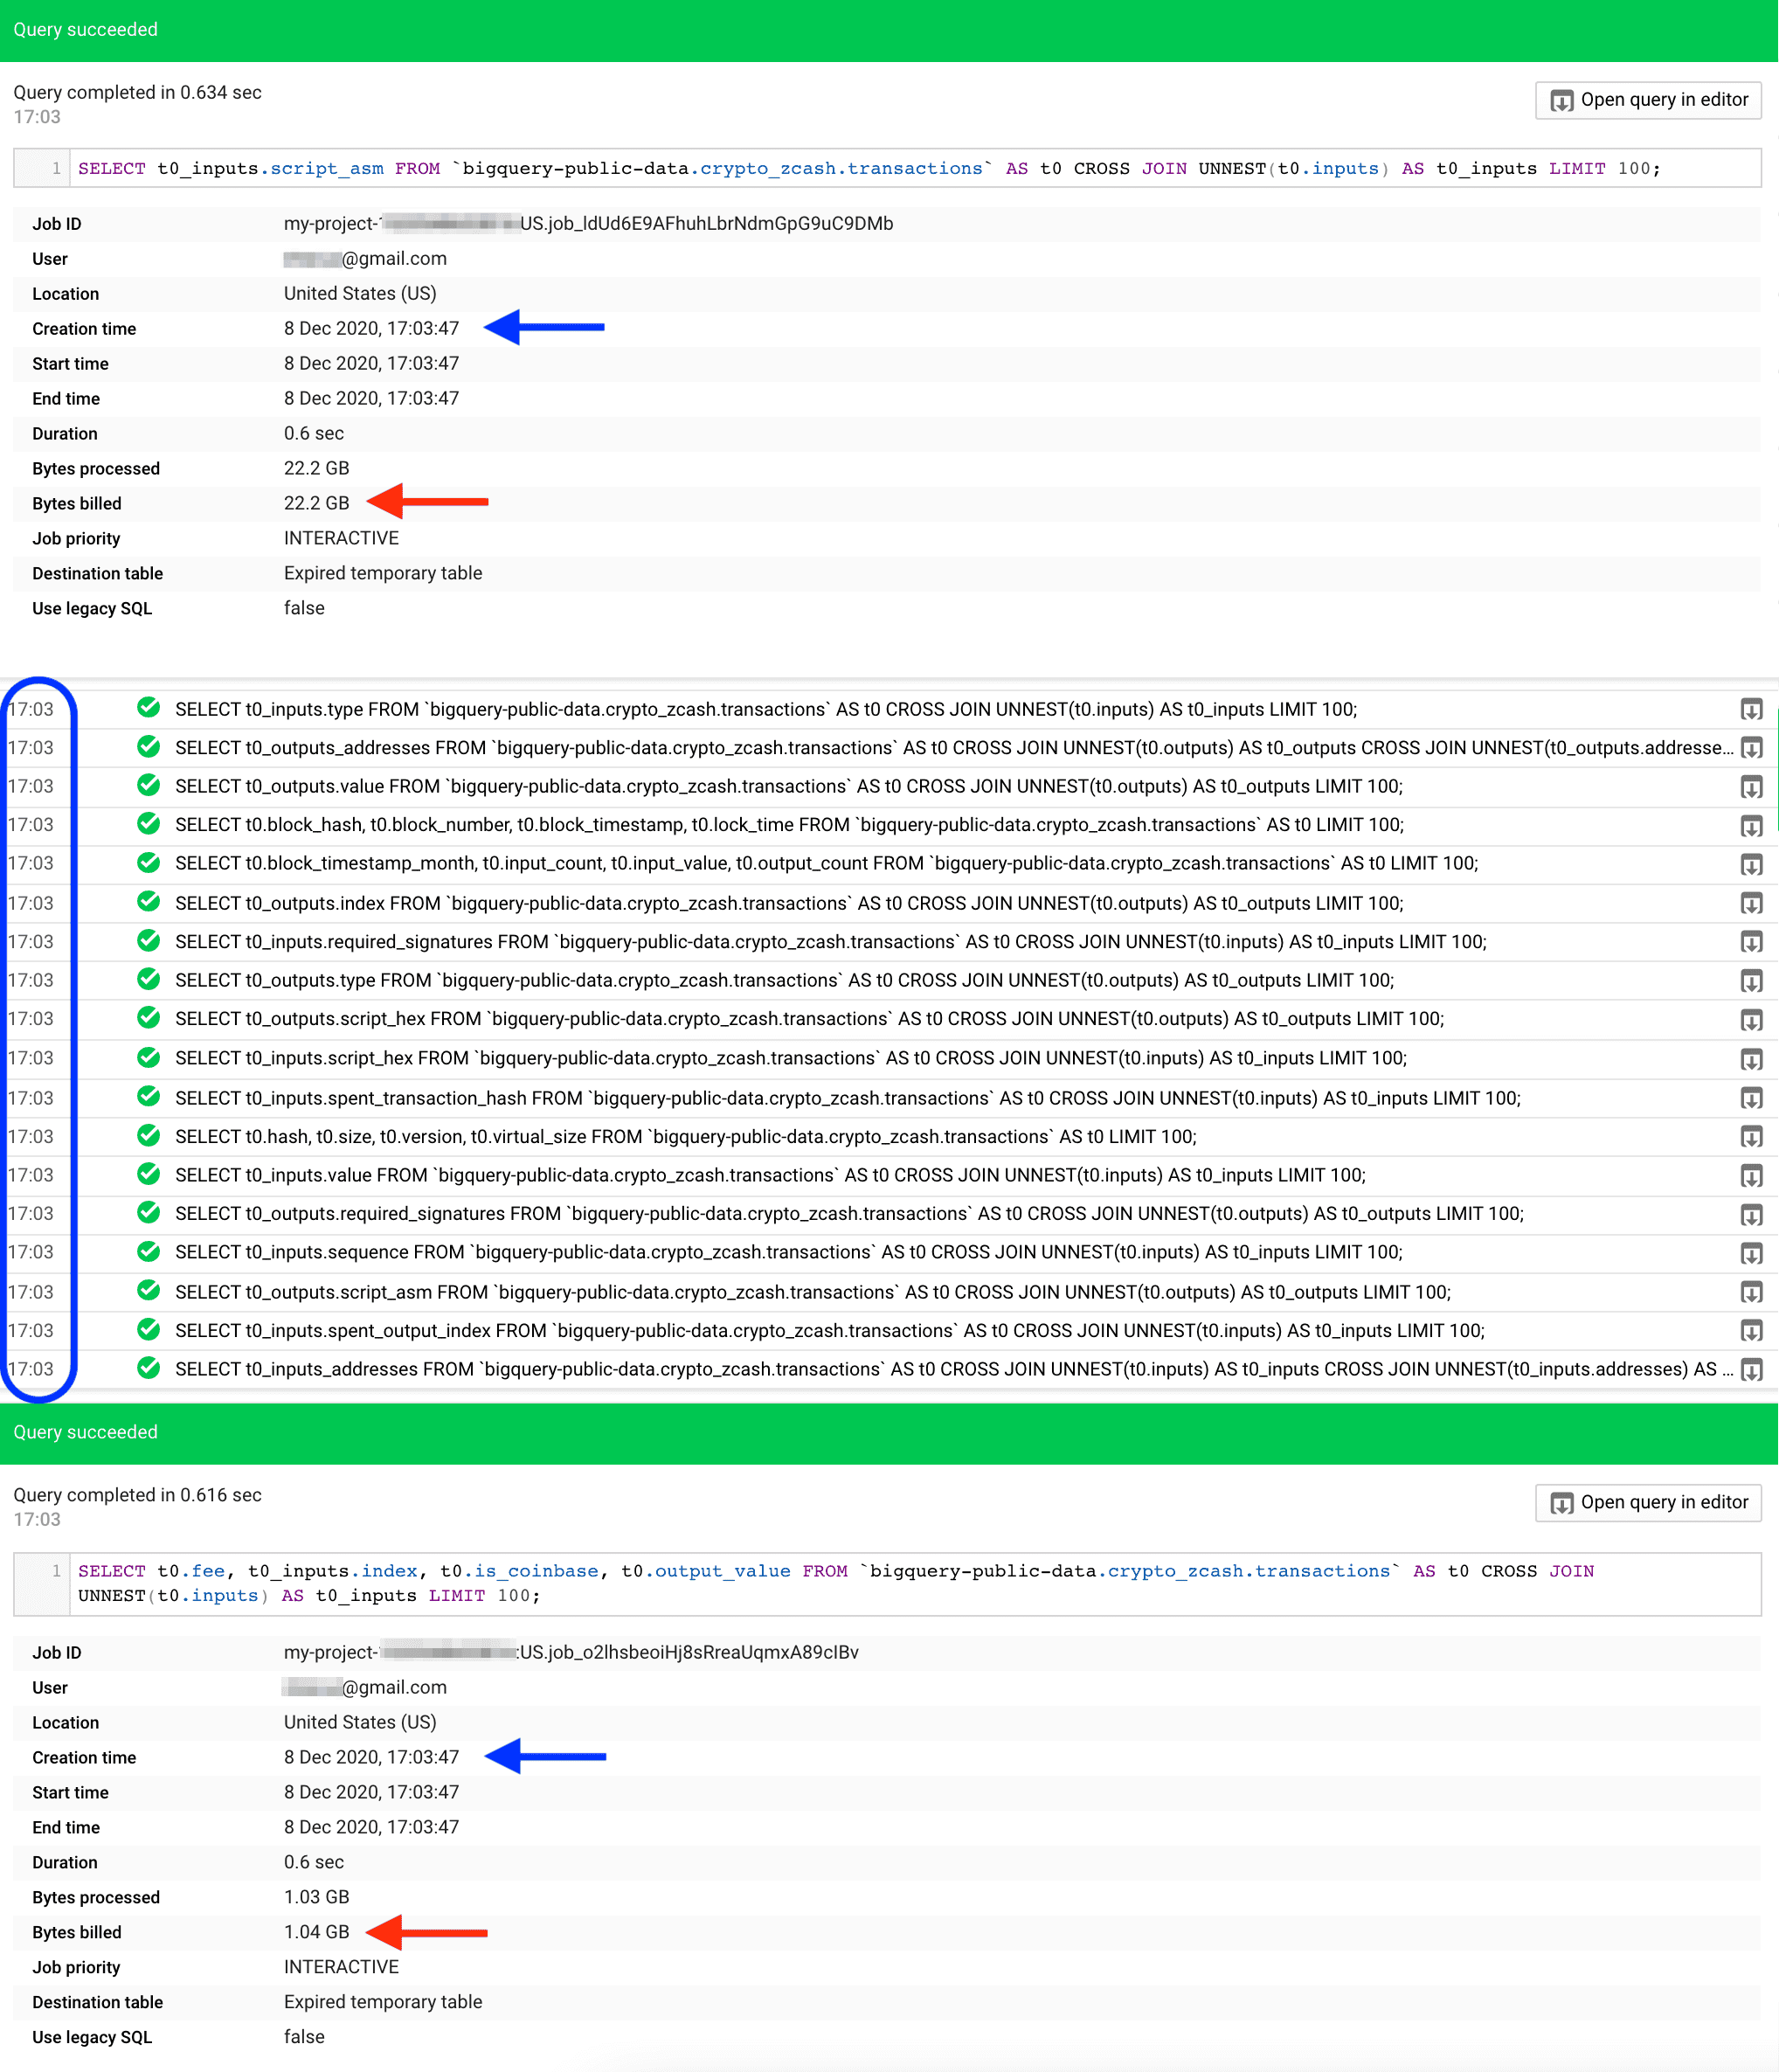
We may also be surprised with the fact that we have been charged for a full table scan in total, since each individual request performs a full scan over group of columns, like here:

The newly created report would highlight such behaviour easily, and maybe catch our attention before we continue to create and query over partition_filter_required=False tables.
Best practice: before connecting a big table, make sure it is partitioned and partition_filter_required = true. In the case of clustered tables LIMIT n would save us from a full scan too, but enabling partition filter required option is a good practice to follow in each case.
Data Studio delivers its own cache functionality on a datasource level. We can establish from 15 minutes up to 12 hours refresh rate frequency (default). However, on many occasions BigQuery requests will be generated despite the “fetched from cache” thunder icon. Moreover, if your data sources are refreshed only once a day, you may get plus one request per each report component. If there was no modification process meantime, we would like such requests to hit the BigQuery’s cache, but there are some blockers we need to avoid. First of all, datasource needs to use Owner credentials to enable caches to all the users in the organization. Once this general requirement is in place, we can take care of smaller ones.
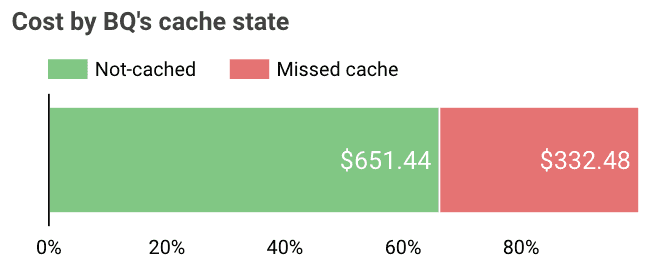
Before partitioning was introduced, BigQuery offered sharded tables as a substitute. The idea behind is trivial: name number of tables of similar schemes with the same prefix but different suffixes and query them in a single SELECT statement. Usually suffix is a date (YYYYMMDD) but it doesn’t have to. You can create same tables for each of business units of your company (e.g. employee_hr and employee_it) and query all together at the same time with SELECTFROM dataset.employee_* WHERE name =‘John’ if you want to send best wishes on John's name-day. While it’s a versatile solution it comes at a price of no-caching.
Best practice: if possible, use UNION ALL instead of Wildcard Tables functionality to enable BigQuery caching.
‘Non-deterministic’ is a technical term for a group of functions that may return different results each time they are called. In Google BigQuery case those functions are CURRENT_DATE, CURRENT_TIMESTAMP, SESSION_USER or RAND. While they might be useful in certain circumstances (especially the CURRENT_DATE one) we need to remember they are preventing usage of BigQuery’s cache and so could boost querying costs. Data Studio has a solution to bypass some of the cases with the use of Custom Parameters for Custom Query connections.
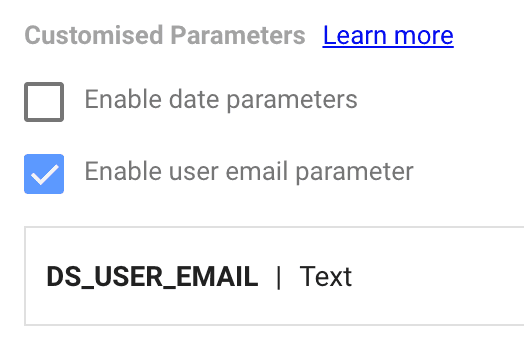
Best practice: try to avoid non-deterministic functions in data sources, or use Custom Parameters as a substitution if possible.
One of the main reasons for having custom queries as a source connection is to address the need for window functions usage. There are several reporting cases requiring usage of RANK, LEAD or PERCENTILE functions over a filtered portion of data. However, window functions, in contrast to aggregation functions, do not inherit filters from outer subqueries. Let’s use an example. If we want to take one dimension and one measure from a single partition, the simplest SELECT would be:
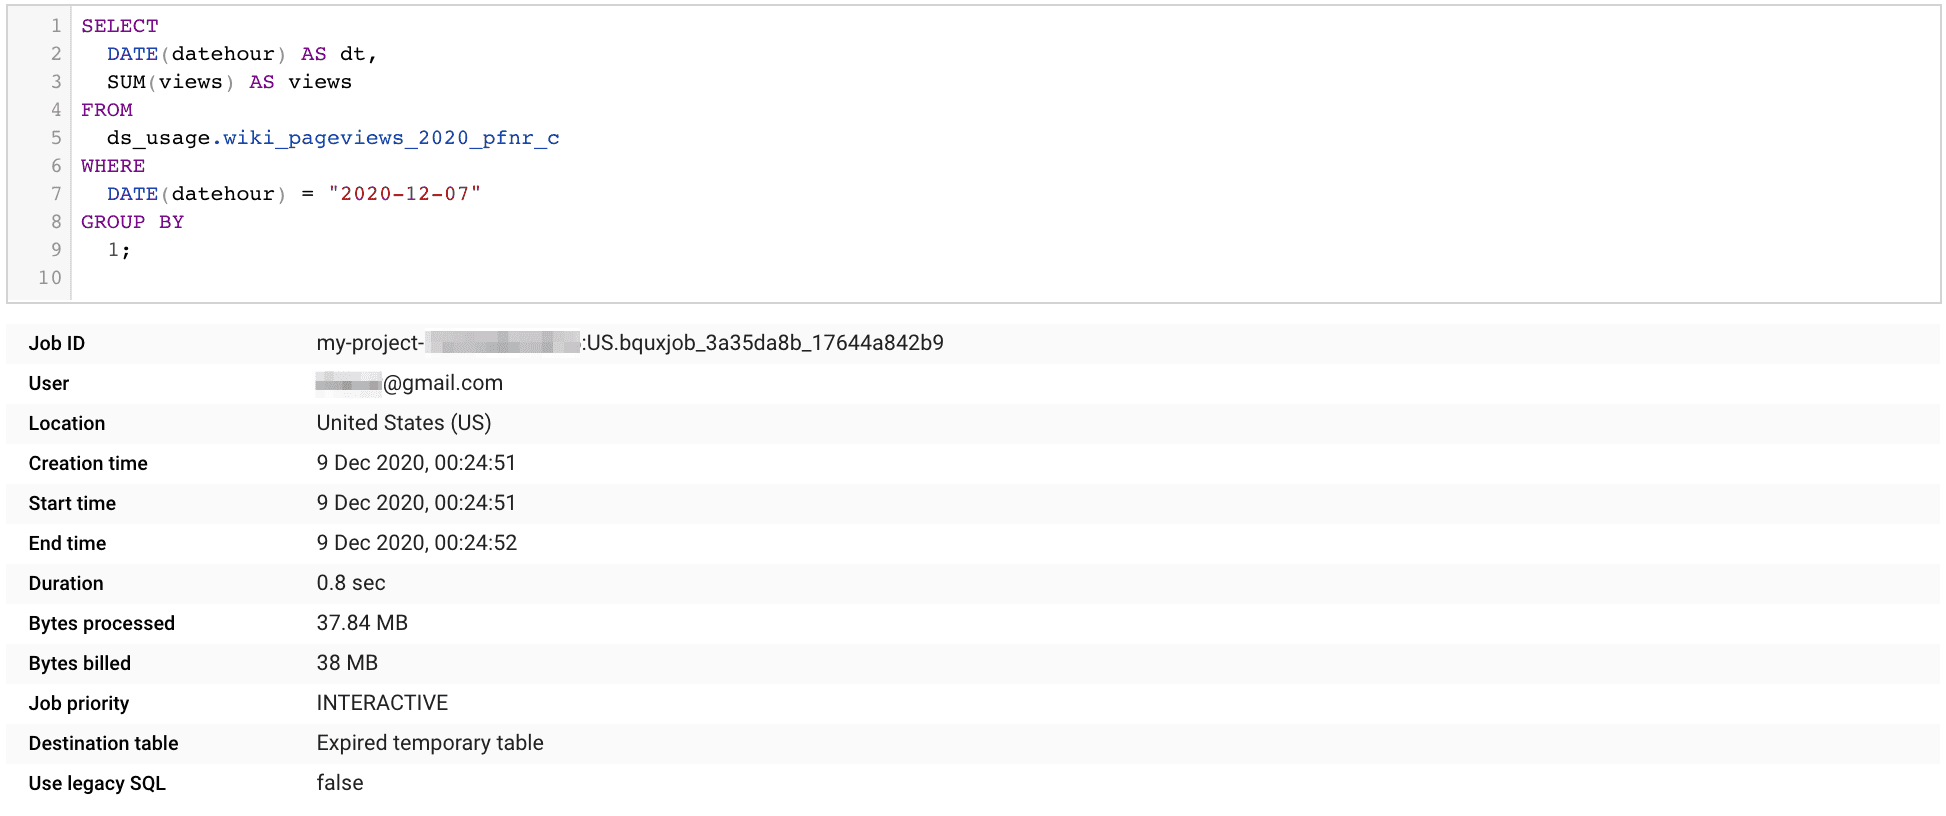
But since all Google Data Studio requests are using data source as a subquery, let’s see how it would work with a custom query connection:
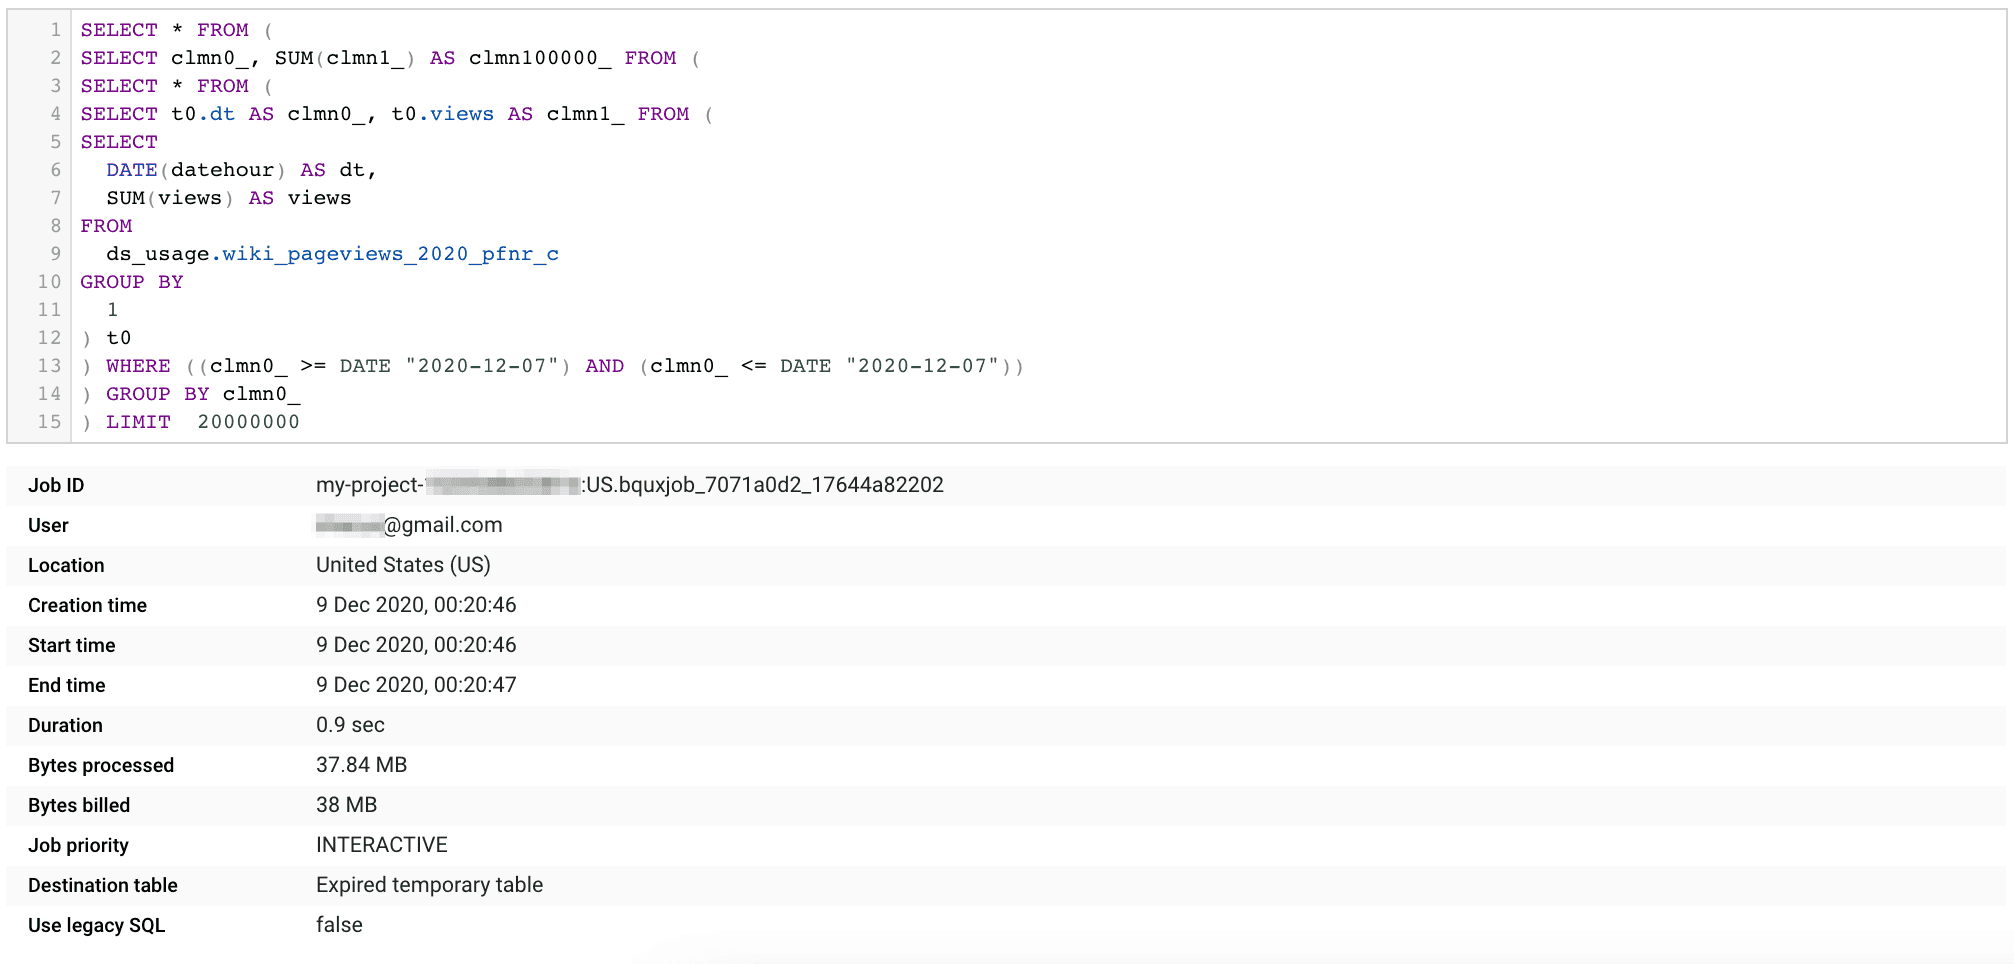
While the partition filter is two levels from the data source subquery, still it acts like it was on the same level. It acts like it was transposed into the most inner query, and so we get the same cost as in the previous statement. Now let’s change SUM from aggregation version to window:
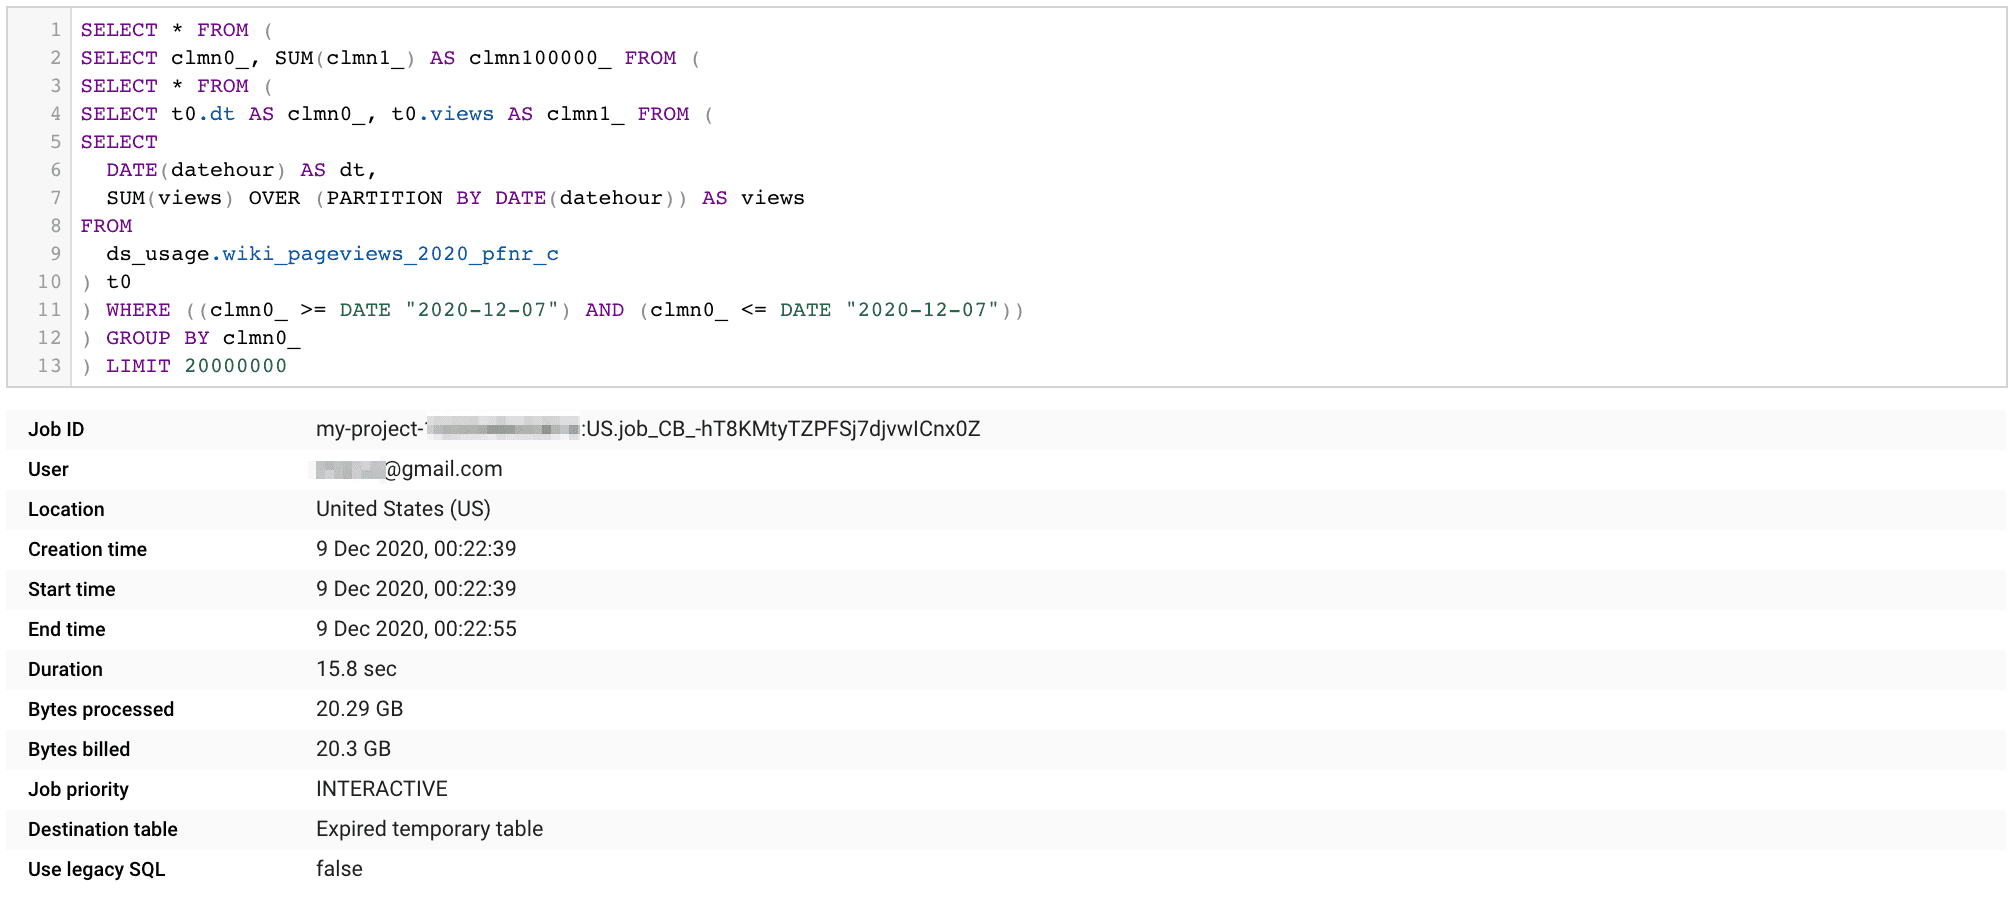
While the statement looks very similar to the previous one, there is a drastic change in bytes billed. Partition filter takes action after a window function is called for all the rows of each individual partition. Changing the date range filter will not affect the number of partitions being scanned, and will not limit the query cost. What we can do however is move the date filter to the same subquery as our window function. Again, we should use Data Studio’s Custom Parameter, like here:
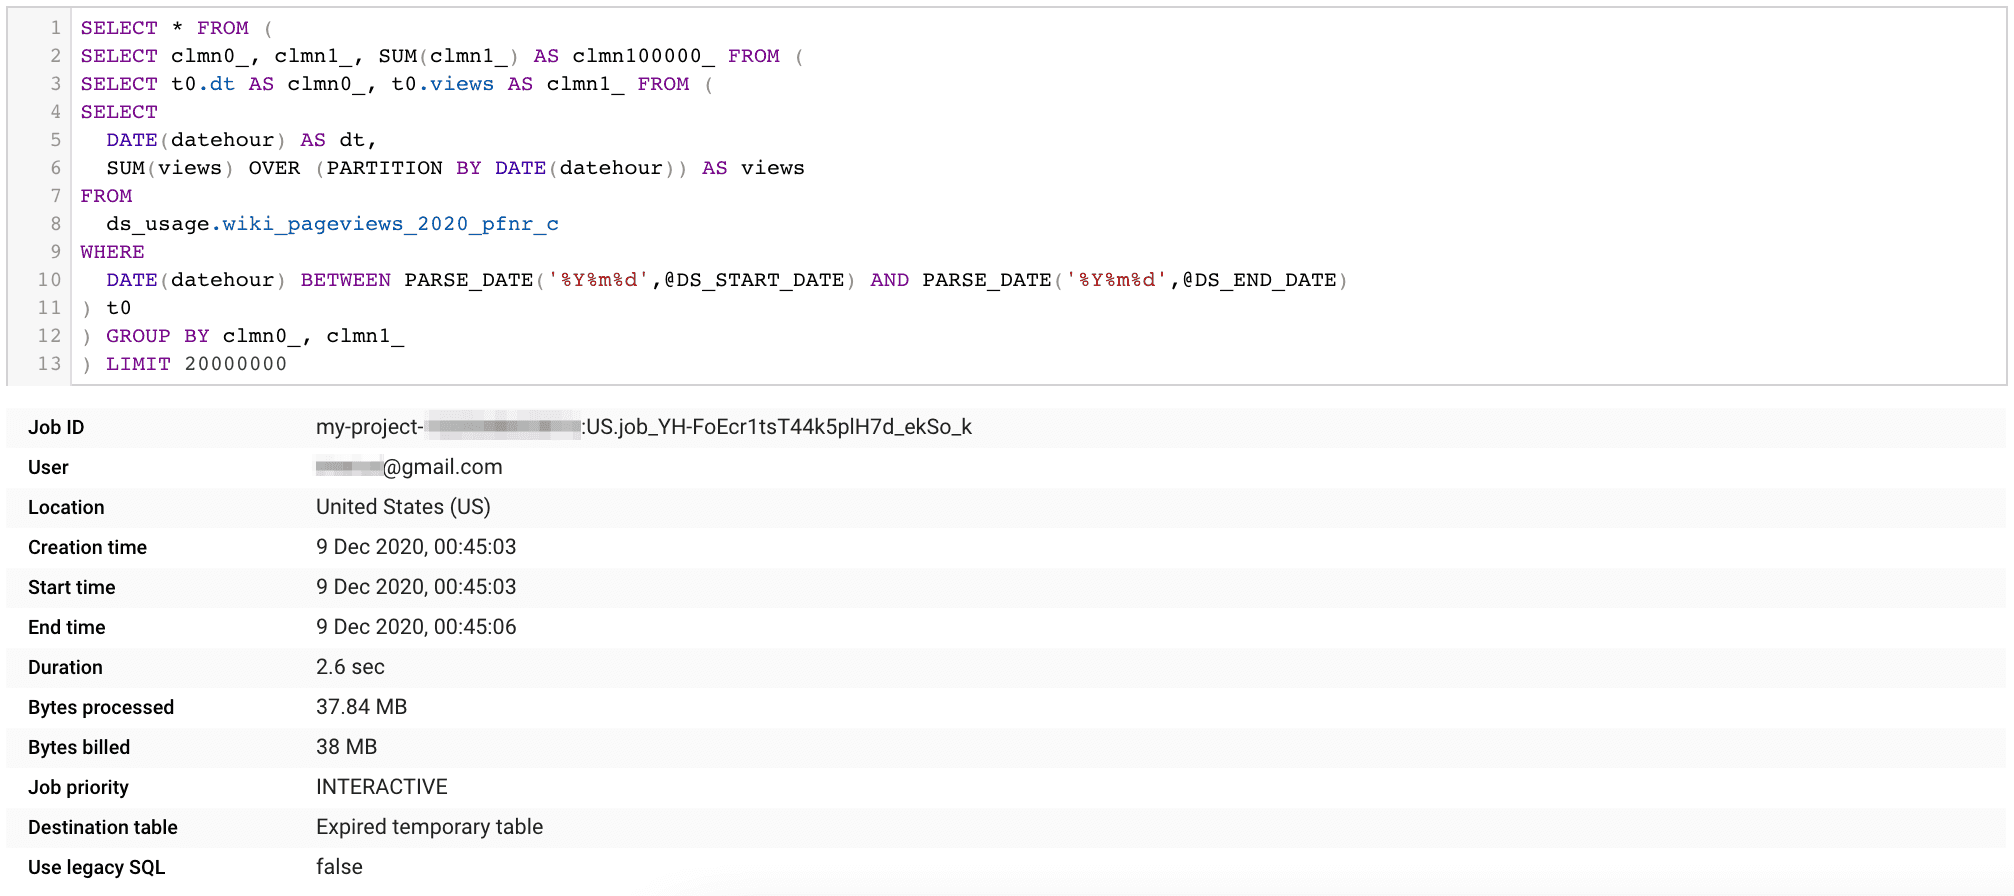
Best practice: for custom query data sources that requires window functions use custom parameters to prevent full scanning.
Filters are essential in order to make reports interactive. Usually, their main job is to switch between different parts of a bigger picture, or with the use of parameters to even change the angle of the insight. Limiting query costs is an important function, too. But there are some corner cases where the ease of use can hit our wallet hard.
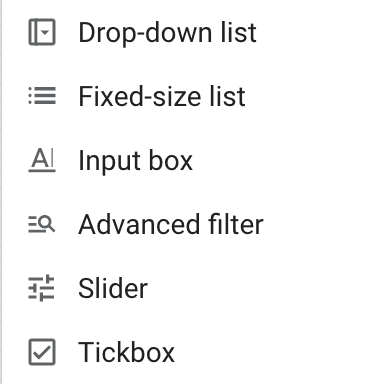
Google Data Studio provides 6 types of filter controls to our disposal, not including Date Range of course. Probably the most often used one is a Drop-down list control. Success of this filter comes from its ease of use, for both creator and viewer. Creator doesn’t have to think of all possible values the filter should cover since it looks up the underlying data source and returns all available ones. A lookup means additional SELECT on the BigQuery side. If there is a page level Date Range control used then at least partition filtering for this statement will be conducted. But if there is no partition limitation, then the full scan of a single field (or two fields if the filter contains a measure) takes place. Even with a limited number of partitions, it may still be overkill if the field contains just a few options. With the “boolean” case we don’t need to scan the entire month of data to know there are only two values possible! Instead of a Drop-down we should use a Tickbox filter here, which will not produce any additional costs. If our filter is about to provide more than two options, but still a defined number (e.g. country codes) we can use an Input box component, or use a Drop-down but this time pointing to the dimensional table country_codes.
There are two more controls that do lookup datasource to get a list of values: a Fixed-size list and a Slider. Ideally, before we use them, we should check if we really can’t replace them with any of the basic ones, or change the scope to dimensional sources, or use a combination of Data Studio parameters and calculated fields. In the last case, it takes some additional work since we need to create a parameter [optionally define a list of possible values], create an additional field that does extract the parameter's value, and finally a second field that will compare the extracted value with the database field. It looks overwhelming but will pay back with every single report’s refresh over the course of time.
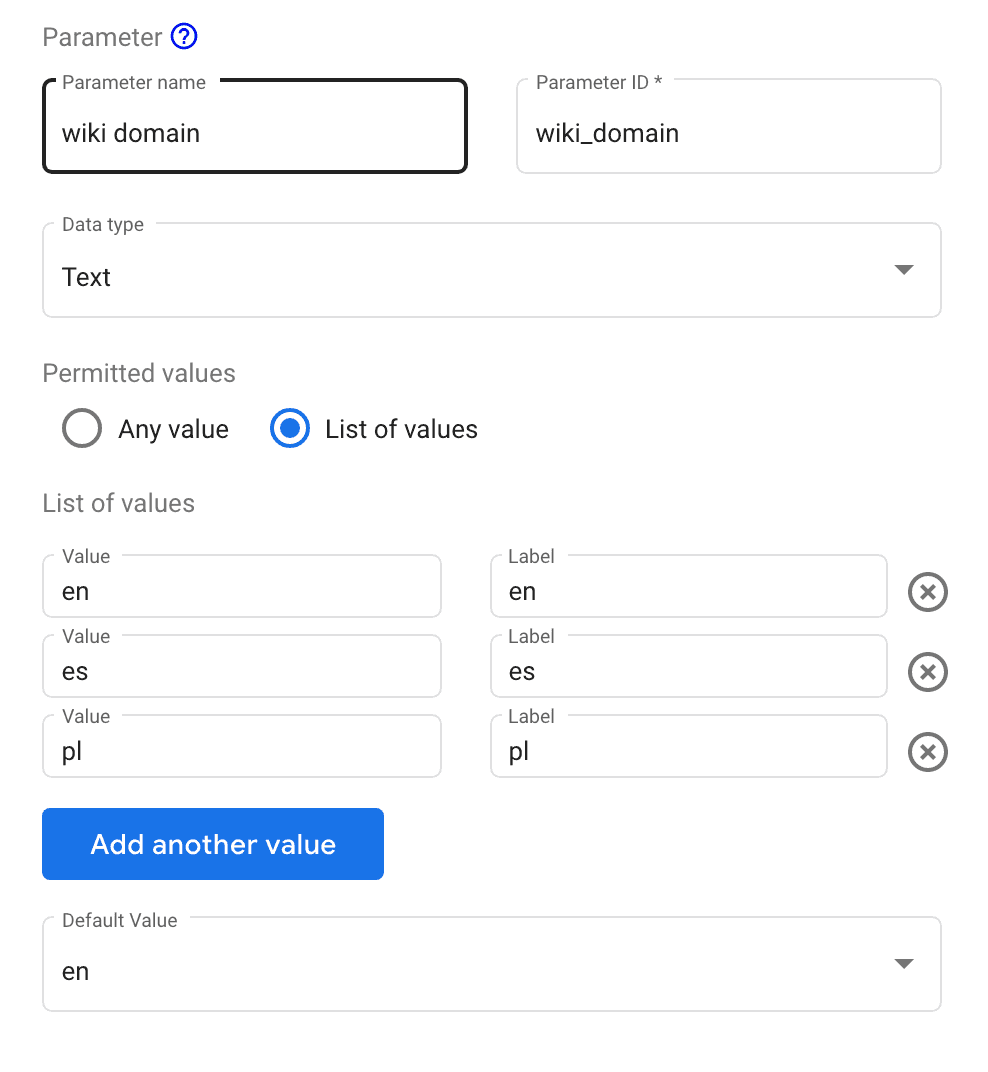
Best practice: Limit number of Drop-down filters. Use Input box or Advanced filter types instead. Parameters and edit-pane filters may be a good substitution for a shortlist of values like business unit names. Using a dimensional table as a separate data source just for filtering is a good option too.
Google Data Studio is a free reporting tool and we need to accept certain compromises on functionality and effectiveness it delivers. One of the features we would expect in an organizational usage of any BI tool is auditing. While there is new Data Studio’s audit log available for the content usage, the underlying DWH usage is still a mystery as no built-in functionality was introduced so far. We can however rely on BigQuery in case it is the one being connected. With a single metadata view and few lines of code we can separate Data Studio requests, and even divide them into categories. Then we are only one step from the insight on how Data Studio performs. Cost analysis is probably the one we have been missing most. Once we have it, we can identify inefficiencies and bad habits in using those two products together. With the right insight and best practice knowledge, we are ready to limit these costs generators in the future.

Having Google Data Studio’s queries under watch is nice, but wouldn’t it be great to extract datasource out of each? In the end, each user should have only one connection for each underlying table or view. If not, they are probably custom queries, which means they differ from each other, right?
And wouldn’t it be good to know who triggered the request, and from which report or page? There is a chance Data Studio’s product developers will provide these missing puzzles by enriching log labels, but until it happens we can think of other tweaks, like a “web beacon” alike chart hidden on each report page.
In the first part of the series "Power of Big Data", I wrote about how Big Data can influence the development of marketing activities and how it can…
Read moreThe Data Mass Gdańsk Summit is behind us. So, the time has come to review and summarize the 2023 edition. In this blog post, we will give you a review…
Read moreWill AI replace us tomorrow? In recent years, there have been many predictions about what areas of our lives will be automated and which professions…
Read moreAirflow is a commonly used orchestrator that helps you schedule, run and monitor all kinds of workflows. Thanks to Python, it offers lots of freedom…
Read moreIn today's world, real-time data processing is essential for businesses that want to remain competitive and responsive. The ability to obtain results…
Read moreThe rapid growth of electronic customer contact channels has led to an explosion of data, both financial and behavioral, generated in real-time. This…
Read moreTogether, we will select the best Big Data solutions for your organization and build a project that will have a real impact on your organization.
What did you find most impressive about GetInData?