Streamline your data-driven approach and improve business insights with integrated analytics and more effective dashboards and visualizations
Integrate your Data Lake and other databases in unified reporting and analytics solutions for driving better business insights and a great user experience. Take advantage of the real-time analysis of your data, thanks to which the decisions made will optimize the functioning of your business even more.

They get value from BI & Analytics Platform:


How does the BI & Analytics Platform work?
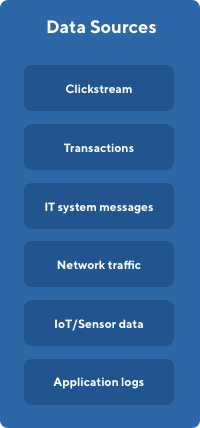
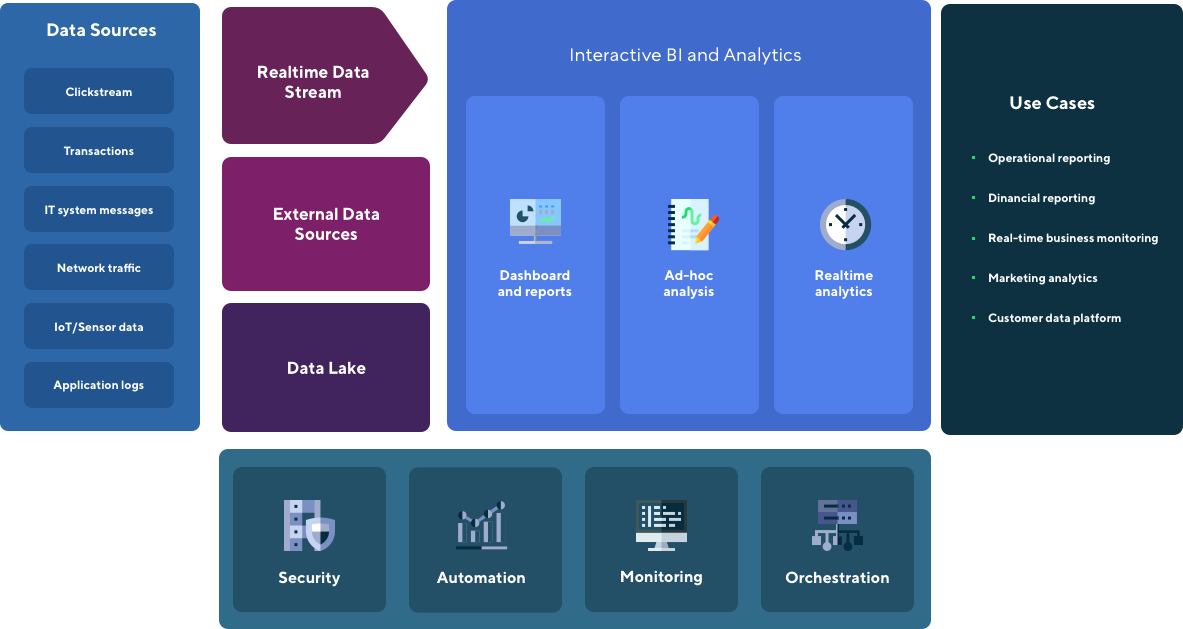
Data Source
Your IT systems exchange vast amount of information, that includes technical messages about opening a form on your website, network traffic information, sensor data, but also more meaningful information like new orders from your customer.
You obviously have access to most of that information in dedicated systems, in a more aggregated manner and on-demand. However, what would you do if you had a chance to combine messages from different systems and react on the spot, just after they were generated? Event processing system are designed to analyse messages in real-time, enrich them with external information, combine into more complex events, analyze for patterns and trigger actions.

Realtime data stream
The business value of information decreases over time. It may be useful for your use case to analyse data in real time, so you can monitor your business activities and react on the spot.

External data sources
It may happen that you want to use data that is not available in your Data Lake. Our design allows you to access data from multiple systems, like external databases, files and data stores, within a single query. You do not need to copy data from different sources to use them in your report.

Data Lake
Data Lake is a place where your structured (like transactions from ecommerce system), semi-structured (e.g. XML or JSON files) and unstructured data (these can be image, but also documents) data is loaded and made accessible for reporting and analytics purposes. Data is stored in a secured manner, what means it can be only accessed by authorised users, and in optimized data structures for performance reasons.
Interactive BI and Analytics

Dashboards and reports
Dashboards and reports allow users to analyse the data in a standardised, predefined way. They can be made more appealing with attractive visualisations and provide functionalities like drill down for better data understanding. Dashboards are refreshed according to defined schedule or accessible on demand. While creating reports you can define an OLAP cube to speed up calculations and enable user to look at data using different dimensions.

Ad-hoc reporting
Ad-hoc reporting is the place where user can verify his/her hypothesis regarding data insights. Using interactive tool you will be able to connect to Data Lake or other data sources - they all create a federated data source that you can query no matter where data is physically stored.

Real Time analytics
In Real Time analytics you need fast query performance on data that is ingested and aggregated live. You want to build dashboards with instant data visibility, but also to perform ad-hoc analysis on data going through your data stream.

Security
Security and access management tool allows to control user access to data and components of the environment. It provides audit capabilities for verifying who has access to specific resources.

Automation
Deployment automation with proper configuration management are key to ensure the high quality of software delivery and to reduce risk of production deployments. All our code is stored in version control system. We design tests to be a part of the Continuous Integration and Continuous Deployment pipelines.

Monitoring
Complex monitoring and observability solution gives detailed information on the state and performance of the components. You can also deploy metrics to observe application processing behaviour. Monitoring includes also alerting capabilities, needed for reliability and supportability.

Orchestration
Originally all of the components of Hadoop ecosystem were installed with Yarn as an orchestrator to achieve scalability and manage infrastructure resources. Nowadays Kubernetes is becoming a new standard for managing resources in distributed computing environments. We design our applications and workloads to work directly on Kubernetes.
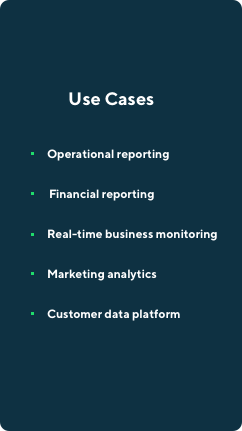
Use cases
The need of having proper reporting in your business is rather indisputable. However having a unified access to all your data and being able to combine data in a single report from different sources might bring your analytics capabilities to a higher level. Access to proper technology will not only increase your Team productivity but also improve reliability and consistency of your reporting. It is also a foundation for becoming a data-driven organisation.
How does the BI & Analytics Platform work?
What is BI & Analytics Plaftorm?
BI & Analytics Platform is an advanced set of tools that helps the organization to collect data, process it, and draw conclusions. It can also support real-time analytics. Thanks to Business Intelligence solutions, you can turn your data into information and knowledge to make business decisions based on data
How can BI & Analytics Platform benefit your business?
Below we present the possibilities offered by BI & Analytics Platform. If you need interactive reports, instant business insight, or indications of the most important data from the point of view of your organization, this platform is the perfect Big Data solution for you
Business intelligence toolset
The platform provides quick and direct access to information that will help to control your operations and plan the growth of your business.
Interactive reports
The reports prepared thanks to the platform, also changing in real-time, will allow for the most accurate drawing of conclusions that will help to optimize the activities of the organization.
Rapid business insight
Real-time analytics allows you to react to changes visible thanks to the data flow at any time and, as a result, to be up to date all the time.
Simplicity
the platform is prepared so that members of the organization can easily and at any time access the most important data for themselves.
Analytics adjustment
allows you to adjust the most important indicators to your needs to react to the most important data. Thanks to this, individual units with access to the platform will not be exposed to the time-consuming search for the most important data for them, instead, they will have immediate access to it.
Get Free White Paper
Take a look at some of the big data projects delivered by our big data expert team
How we work with customers?
We have a different way of working with clients, that allows us to build deep trust based partnerships, which often endure over years. It is based on a few powerful and pragmatic principles tested and refined over many years of our consulting and project delivery experience.

Your use case

Technical assessment

Solutions proposal

Production-grade solution

Discovery phase

Shared Teams

Extensions

Handover
- Read More

Big Data for Business
If you are interested in how we work with clients, how we develop the project and how we take care of the smallest details, go to the Big Data for Business website.
There you will learn how our Big Data projects can support your business.
- Read More

Knowledge base
We are happy to share with you the knowledge gained through practice when building complex Big Data projects for business. If you want to meet our specialists and listen to how they share their Big Data experiences, visit our knowledge library!
Ready to build your BI & Analytics Platform?
Please fill out the form and we will come back to you as soon as possible to schedule a meeting to discuss about GID Platform
What did you find most impressive about GetInData?